
PostgreSQLのスロークエリを見つけるための調査方法についてまとめます。
- PostgreSQL インストール
- PostgreSQL データベースの作成
- PostgreSQL contribモジュールの使い方
- PostgreSQL contribモジュールの使い方
- PostgreSQL パラメタの設定方法
- PostgreSQL ベンチマークツールの紹介
- PostgreSQL WAL(Write Ahead Log)の基本説明
- PostgreSQL バックアップとリストア
- PostgreSQL PITR(Point In Time Recovery)基本概念の説明
- PostgreSQL PITR(Point In Time Recovery)操作方法の説明
- PostgreSQL PITR(Point In Time Recovery)タイムライン操作
- PostgreSQL ストリーミングレプリケーションの最小構成
- PostgreSQL ストリーミングレプリケーションのパラメタ説明
- PostgreSQL ストリーミングレプリケーションの障害復旧
- PostgreSQL ストリーミングレプリケーションの多段構成
- PostgreSQL ストリーミングレプリケーションのDR向け設定
- PostgreSQL ストリーミングレプリケーションのコンフリクト
- PostgreSQL 自動バキューム(AUTO VACUUM)
- PostgreSQL HOT(Heap Only Tuple)
- PostgreSQL インデックスのメンテナンス
- PostgreSQL 統計情報の更新
- PostgreSQL 実行計画
- PostgreSQL スロークエリの調査方法 (いまここ)
事前準備
検証シナリオの都合上、英語でログ出力されるようにして下さい。日本語でログ出力される場合は、集計に大きな手間がかかります。
PostgreSQLチュートリアルのサンプル教材であるdvdrentalをインポートします。
createdb dvdrental
wget https://sp.postgresqltutorial.com/wp-content/uploads/2019/05/dvdrental.zip
unzip dvdrental.zip
pg_restore -d dvdrental dvdrental.tar
rm dvdrental.tar dvdrental.zip
スロークエリ
ログ出力
PostgreSQLに限らず多くのRDBMSでは一定時間以上を要したクエリをログ出力する機能があります。PostgreSQLの場合は以下の設定をpostgresql.confにlog_min_duration_statementを指定します。
log_min_duration_statementは指定時間以上のクエリをログ出力するパラメタで、時間をミリ秒単位で指定します。0を指定すれば全てのクエリがログ出力され、250を指定すれば250ミリ秒以上がログ出力されます。
以下に指定例を示します。
cat << EOF >> /var/lib/pgsql/13/data/postgresql.conf
log_min_duration_statement = 0
EOF
パラメタ反映後、何らかのクエリを実行すると、以下のようなログ出力が観測できます。
[postgres@centos10 ~]$  tail -f -n 2 /var/lib/pgsql/13/data/log/postgresql-Sun.log
2021-03-28 16:48:46.926 JST [1966] LOG:  duration: 1.142 ms  statement: SELECT * FROM rental WHERE rental_id < 10;
2021-03-28 16:48:51.429 JST [1966] LOG:  duration: 0.205 ms  statement: SELECT * FROM rental LIMIT 5;
CSV集計
log_destinationをcsvlogにするとログがcsv形式で出力されます。log_filenameはログファイル名を指定できます。
以下のような設定をpostgresql.confに加筆し設定を反映させます。
cat << EOF >> /var/lib/pgsql/13/data/postgresql.conf
log_destination = 'csvlog'
log_filename='postgresql'
EOF
log_destinationをcsvlogにすると、以下のようなログを観測する事ができます。
[postgres@centos10 ~]$  tail -f -n 20 /var/lib/pgsql/13/data/log/postgresql.csv
2021-03-28 16:50:08.093 JST,,,1997,,60603530.7cd,5,,2021-03-28 16:50:08 JST,,0,LOG,00000,"listening on Unix socket ""/var/run/postgresql/.s.PGSQL.5432""",,,,,,,,,"","postmaster"
2021-03-28 16:50:08.096 JST,,,1997,,60603530.7cd,6,,2021-03-28 16:50:08 JST,,0,LOG,00000,"listening on Unix socket ""/tmp/.s.PGSQL.5432""",,,,,,,,,"","postmaster"
2021-03-28 16:50:08.099 JST,,,2001,,60603530.7d1,1,,2021-03-28 16:50:08 JST,,0,LOG,00000,"database system was shut down at 2021-03-28 16:50:08 JST",,,,,,,,,"","startup"
2021-03-28 16:50:08.102 JST,,,1997,,60603530.7cd,7,,2021-03-28 16:50:08 JST,,0,LOG,00000,"database system is ready to accept connections",,,,,,,,,"","postmaster"
2021-03-28 16:50:25.362 JST,"postgres","postgres",2050,"[local]",60603541.802,1,"SELECT",2021-03-28 16:50:25 JST,3/0,0,LOG,00000,"duration: 1.220 ms  statement: SELECT d.datname as ""Name"",
       pg_catalog.pg_get_userbyid(d.datdba) as ""Owner"",
       pg_catalog.pg_encoding_to_char(d.encoding) as ""Encoding"",
       d.datcollate as ""Collate"",
       d.datctype as ""Ctype"",
       pg_catalog.array_to_string(d.datacl, E'\n') AS ""Access privileges""
FROM pg_catalog.pg_database d
ORDER BY 1;",,,,,,,,,"psql","client backend"
2021-03-28 16:50:59.132 JST,"postgres","dvdrental",2052,"[local]",60603542.804,1,"SELECT",2021-03-28 16:50:26 JST,3/0,0,LOG,00000,"duration: 69.505 ms  statement: SELECT * FROM payment JOIN customer USING ( customer_id ) JOIN rental USING ( rental_id ) ;",,,,,,,,,"psql","client backend"
2021-03-28 16:51:35.933 JST,"postgres","dvdrental",2052,"[local]",60603542.804,2,"SELECT",2021-03-28 16:50:26 JST,3/0,0,LOG,00000,"duration: 37.632 ms  statement: SELECT * FROM rental JOIN staff USING (staff_id);",,,,,,,,,"psql","client backend"
2021-03-28 16:51:45.132 JST,"postgres","dvdrental",2052,"[local]",60603542.804,3,"SELECT",2021-03-28 16:50:26 JST,3/0,0,LOG,00000,"duration: 0.228 ms  statement: SELECT * FROM rental WHERE inventory_id = 1525;",,,,,,,,,"psql","client backend"
2021-03-28 16:51:49.502 JST,"postgres","dvdrental",2052,"[local]",60603542.804,4,"SELECT",2021-03-28 16:50:26 JST,3/0,0,LOG,00000,"duration: 0.251 ms  statement: SELECT * FROM rental WHERE inventory_id = 1525;",,,,,,,,,"psql","client backend"
2021-03-28 16:51:53.483 JST,"postgres","dvdrental",2052,"[local]",60603542.804,5,"SELECT",2021-03-28 16:50:26 JST,3/0,0,LOG,00000,"duration: 0.530 ms  statement: SELECT * FROM rental WHERE inventory_id = 1525;",,,,,,,,,"psql","client backend"
2021-03-28 16:52:01.756 JST,"postgres","dvdrental",2052,"[local]",60603542.804,6,"SELECT",2021-03-28 16:50:26 JST,3/0,0,LOG,00000,"duration: 0.308 ms  statement: SELECT * FROM rental WHERE rental_id < 10 ;",,,,,,,,,"psql","client backend"
2021-03-28 16:52:05.105 JST,"postgres","dvdrental",2052,"[local]",60603542.804,7,"SELECT",2021-03-28 16:50:26 JST,3/0,0,LOG,00000,"duration: 0.269 ms  statement: SELECT * FROM rental WHERE rental_id < 10 ;",,,,,,,,,"psql","client backend"
2021-03-28 16:52:15.444 JST,"postgres","dvdrental",2052,"[local]",60603542.804,8,"SELECT",2021-03-28 16:50:26 JST,3/0,0,LOG,00000,"duration: 35.056 ms  statement: SELECT * FROM rental JOIN staff USING (staff_id);",,,,,,,,,"psql","client backend"
csvlogをテーブルへインポートして集計しやすい状態にしましょう。ログ出力形式はPostgreSQLのバージョンによって若干の差異があるため、バージョンに応じたテーブルを作成する必要があります。どのようなテーブルを作成するかは、公式マニュアルの「19.8. Error Reporting and Logging / 19.8.4. Using CSV-Format Log Output」を参照しましょう。PostgreSQL 13の場合は以下のようになります。
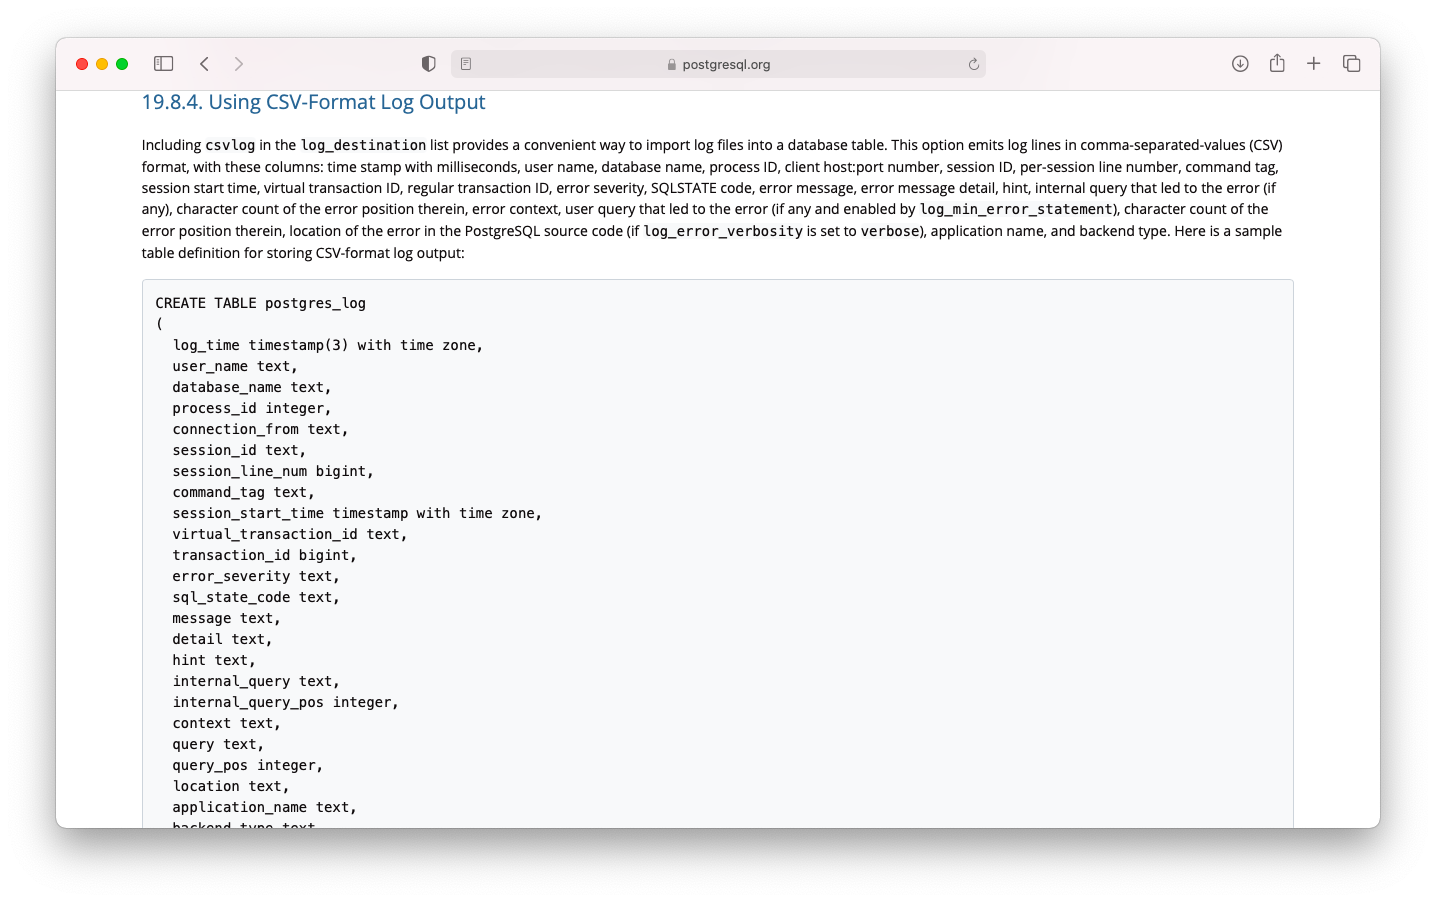
createdb query_log
psql query_log << EOF
CREATE TABLE postgres_log
(
  log_time timestamp(3) with time zone,
  user_name text,
  database_name text,
  process_id integer,
  connection_from text,
  session_id text,
  session_line_num bigint,
  command_tag text,
  session_start_time timestamp with time zone,
  virtual_transaction_id text,
  transaction_id bigint,
  error_severity text,
  sql_state_code text,
  message text,
  detail text,
  hint text,
  internal_query text,
  internal_query_pos integer,
  context text,
  query text,
  query_pos integer,
  location text,
  application_name text,
  backend_type text,
  PRIMARY KEY (session_id, session_line_num)
);
EOF
csvlogをテーブルへインポートします。
psql query_log << EOF
COPY postgres_log FROM '/var/lib/pgsql/13/data/log/postgresql.csv' WITH csv;
EOF
前述のテーブルだけでは集計の手間がかかるため、集計しやすいVIEWを作成しましょう。Let’s POSTGRES / スロークエリの分析に掲載されているVIEWを以下に転記します。なお、このVIEWは英語でログ出力される事を前提としていますので、日本語ログではうまく集計できません。日本語ログの環境ではduration, execute, statementなどを適宜日本語に置き換えましょう。
CREATE VIEW pg_query_log AS
    SELECT
      substring(message,
        E'^duration: ([0-9]*\\.[0-9]*)')::numeric(1000,3) AS duration,
      (regexp_matches(message,
        '^duration: .*ms  (execute|statement).*: (.*)'))[2] AS sql,
      *
      FROM postgres_log
     WHERE error_severity = 'LOG'
       AND command_tag IN ('SELECT', 'INSERT', 'UPDATE', 'DELETE');

SELECT query, count(*) AS calls, sum(duration) AS total_ms
     FROM pg_query_log
    GROUP BY query
    ORDER BY total_ms DESC
    LIMIT 3;
クエリを遅い順に集計する操作例は以下の通りです。
[postgres@centos10 ~]$ psql query_log
psql (13.1)
Type "help" for help.

query_log=# SELECT sql, count(*) AS calls, sum(duration) AS total_ms
query_log-#  FROM pg_query_log
query_log-#  GROUP BY sql
query_log-#  ORDER BY total_ms DESC
query_log-#  LIMIT 3;
                                             sql                                             | calls | total_ms
---------------------------------------------------------------------------------------------+-------+----------
 SELECT * FROM rental JOIN staff USING (staff_id);                                           |     2 |   72.688
 SELECT * FROM payment JOIN customer USING ( customer_id ) JOIN rental USING ( rental_id ) ; |     1 |   69.505
 SELECT d.datname as "Name",                                                                +|     1 |    1.220
        pg_catalog.pg_get_userbyid(d.datdba) as "Owner",                                    +|       |
        pg_catalog.pg_encoding_to_char(d.encoding) as "Encoding",                           +|       |
        d.datcollate as "Collate",                                                          +|       |
        d.datctype as "Ctype",                                                              +|       |
        pg_catalog.array_to_string(d.datacl, E'\n') AS "Access privileges"                  +|       |
 FROM pg_catalog.pg_database d                                                              +|       |
 ORDER BY 1;                                                                                 |       |
(3 rows)

query_log=#