Prometheusはコンテナやクラウドなどの大量コンポーネントを監視する事に特化したソフトウェアです。このページではPrometheusに対して、監視対象のホストを追加する方法を説明します。
前提
参照資料
動作確認済環境
- Rocky Linux 8.5
- Prometheus 2.36.2
- node_exporter 1.3.1
構成図
2台の仮想マシンに対して、以下コンポーネントがインストール済の状態とします。
+----------------+ +----------------+
| linux010       | | linux020       |
| 172.16.1.10/24 | | 172.16.1.20/24 |
| node_exporter  | | node_exporter  |
| prometheus     | |                |
+----------------+ +----------------+
監視対象の追加
prometheus.ymlにjobを追加すれば仮想マシンを追加できます。prometheus.ymlを以下のように編集すれば、2台の仮想マシンを監視する事ができます。
cat << EOF > /etc/prometheus/prometheus.yml
scrape_configs:
  - job_name: prometheus
    static_configs:
      - targets:
        - localhost:9090
  - job_name: linux010 node
    static_configs:
      - targets:
        - 172.16.1.10:9100
  - job_name: linux020 node
    static_configs:
      - targets:
        - 172.16.1.20:9100
EOF
Prometheusを再起動します。
systemctl restart prometheus.service
動作確認
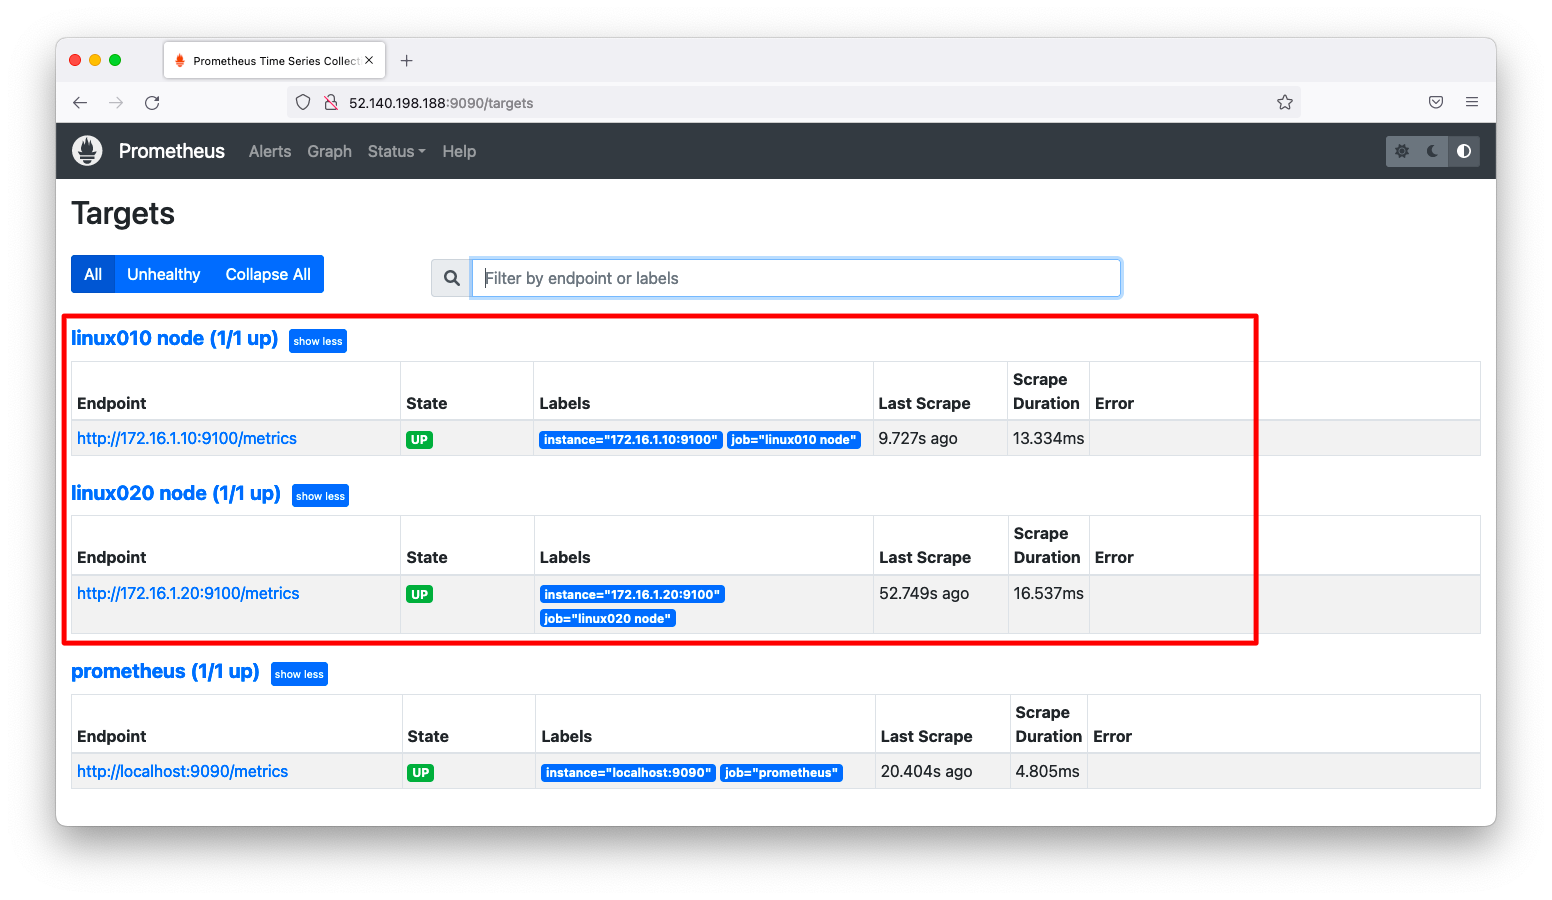
targetsページ(http://<ip_addr>:9090/targets)に2台の仮想マシンが登録されている事を確認します。
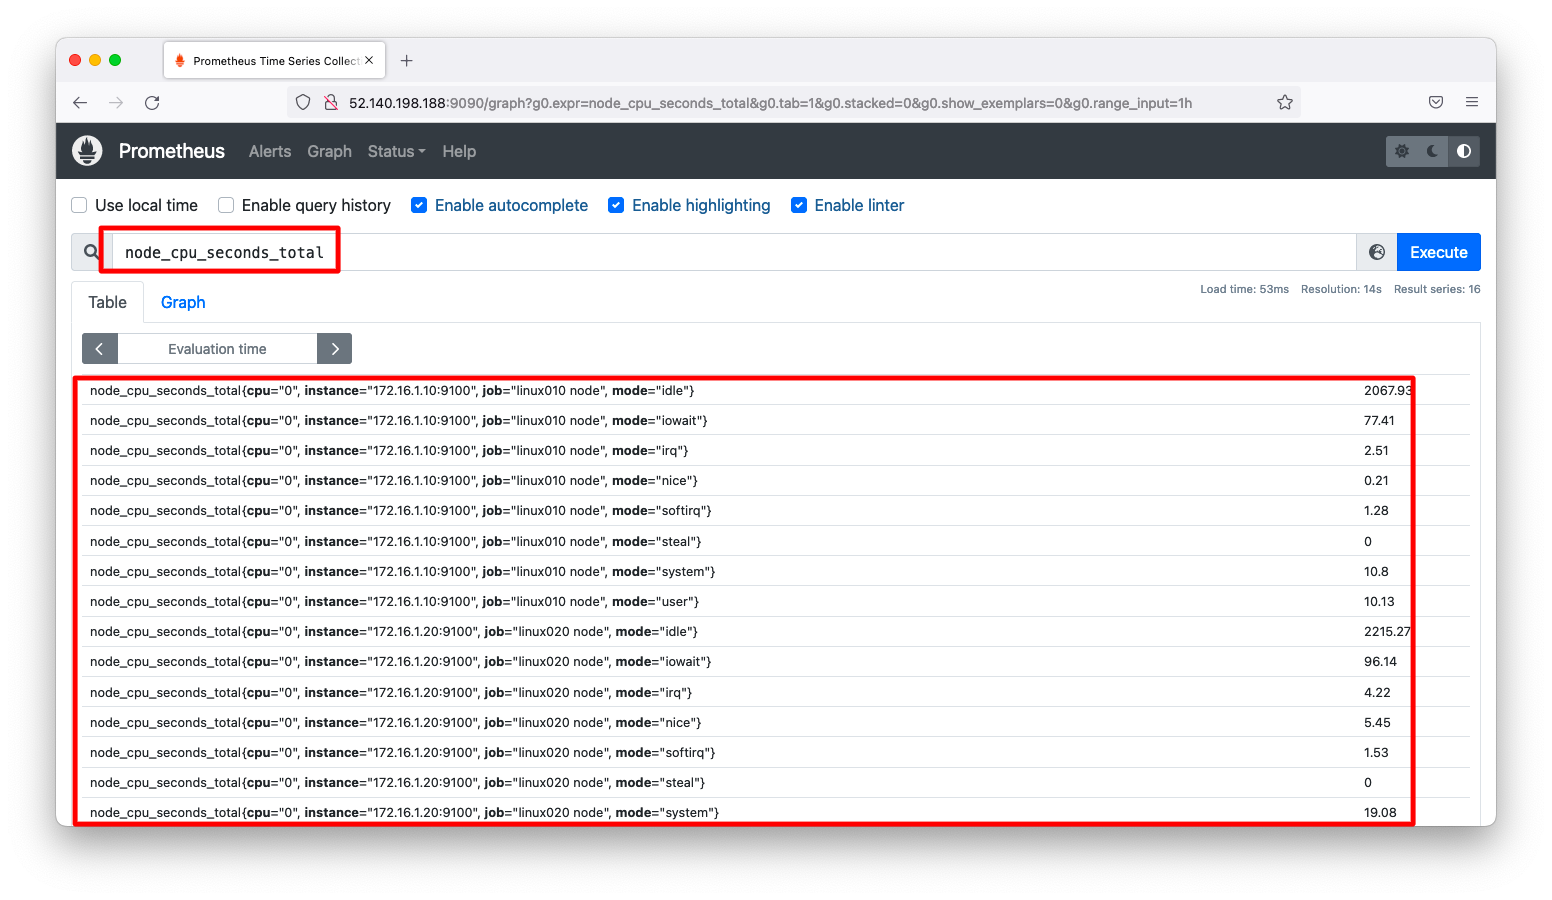
graphページ(http://<ip_addr>:9090/graph)を表示すると、linux010とlinux020の両方の仮想マシンのメトリックが表示されています。
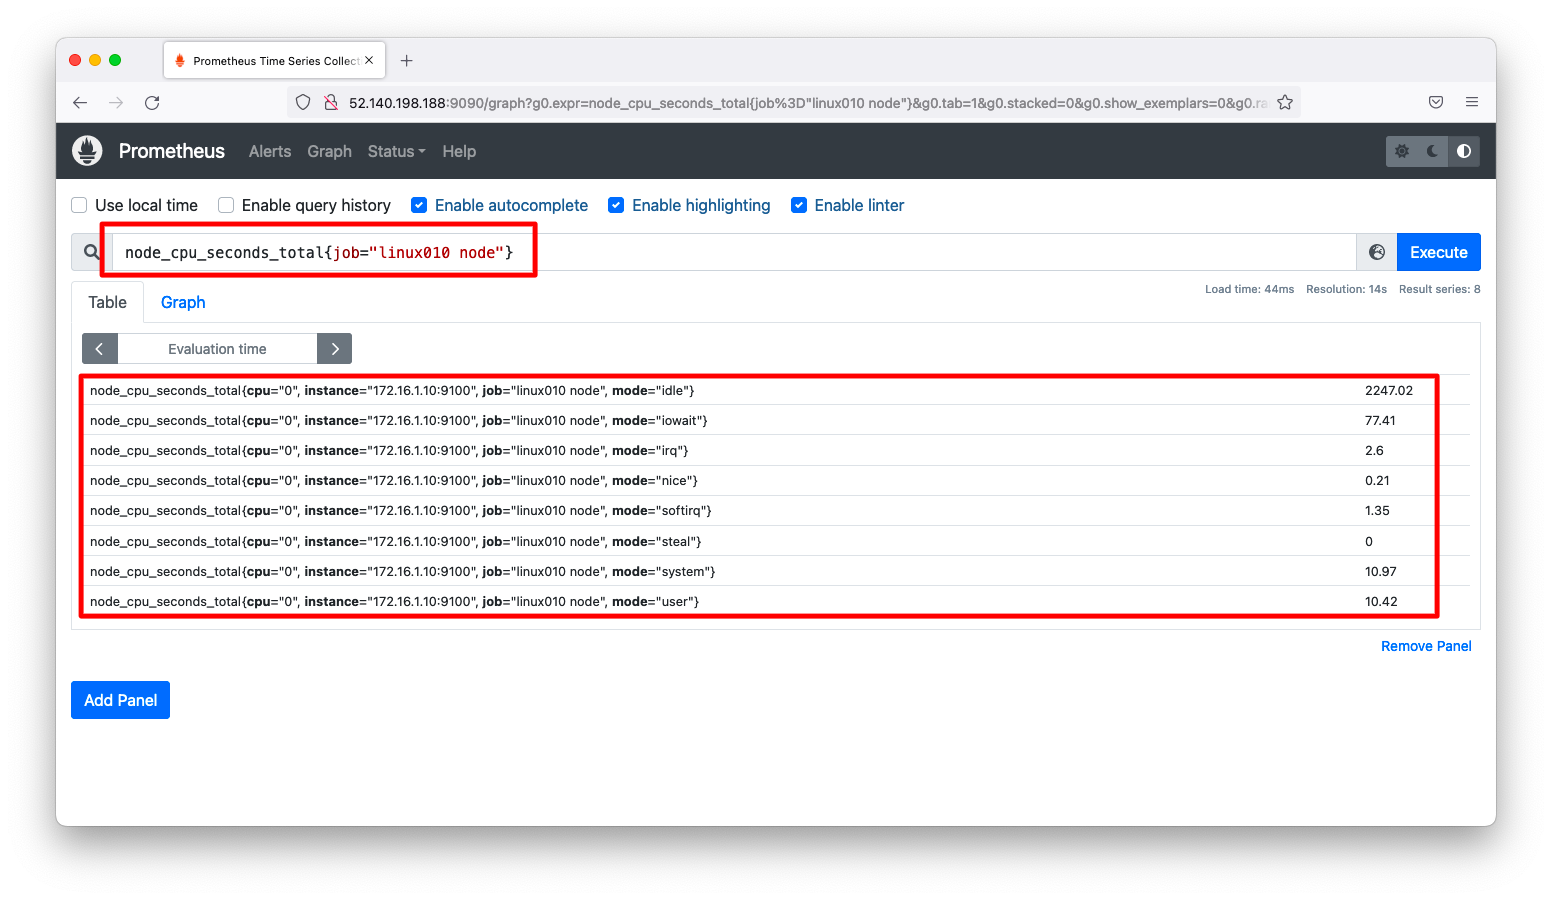
もし、特定の仮想マシンのみを表示したい場合は検索窓に以下のような絞り込みの指定(PromQL)をすると、特定の仮想マシンのみ表示する事ができます。
node_cpu_seconds_total{job="linux010 node"}