PrometheusはExporterと呼ばれるメトリック情報を公開するコンポーネントから情報を収集します。Exporterは前述の説明で紹介した「Node Exporter」以外にも様々なメトリックを公開するものがあります。OfficialなExporterであるblackbox_exporterの使い方を説明します。blackbox_exporterは、ICMPやHTTPによる監視をします。
前提
参照資料
動作確認済環境
- Rocky Linux 8.6
- Prometheus 2.36.2
- blackbox_exporter 0.21.1
構成図
3台の仮想マシンに対して、以下のコンポーネントをインストールします。prometheusとnginxのインストール方法は説明を省略します。
+-------------------+ +----------------+ +----------------+
| linux010          | | linux020       | | linux030       |
| 172.16.1.10/24    | | 172.16.1.20/24 | | 172.16.1.30/24 |
|                   | |                | |                |
| prometheus        | | nginx          | | nginx          |
| blackbox_exporter | |                | |                |
+--^----------------+ +----------------+ +----------------+
blackbox_exporterのインストール
dnf install blackbox_exporter
blackbox_exporterを起動します。
systemctl enable blackbox_exporter.service --now
blackbox_exporterの設定は/etc/prometheus/blackbox.ymlに記述します。デフォルト設定でも十分動作しますが、後述の説明で必要に応じて改修します。
modules:
  http_2xx:
    prober: http
  http_post_2xx:
    prober: http
    http:
      method: POST
  tcp_connect:
    prober: tcp
  pop3s_banner:
    prober: tcp
    tcp:
      query_response:
      - expect: "^+OK"
      tls: true
      tls_config:
        insecure_skip_verify: false
  grpc:
    prober: grpc
    grpc:
      tls: true
      preferred_ip_protocol: "ip4"
  grpc_plain:
    prober: grpc
    grpc:
      tls: false
      service: "service1"
  ssh_banner:
    prober: tcp
    tcp:
      query_response:
      - expect: "^SSH-2.0-"
      - send: "SSH-2.0-blackbox-ssh-check"
  irc_banner:
    prober: tcp
    tcp:
      query_response:
      - send: "NICK prober"
      - send: "USER prober prober prober :prober"
      - expect: "PING :([^ ]+)"
        send: "PONG ${1}"
      - expect: "^:[^ ]+ 001"
  icmp:
    prober: icmp
監視の実装
ICMP
デバッグ操作
Blackbox Exporterはtcp9115でListenしています。Blackbox Exporterに対して、クエリ文字列でモジュール名と監視対象ホストを指定すると、監視結果が出力されます。
例えば、www.google.co.jpを監視したいならば、以下のようなクエリ文字列を指定します。
[root@linux010 ~]# curl 'http://localhost:9115/probe?module=icmp&target=www.google.co.jp'
# HELP probe_dns_lookup_time_seconds Returns the time taken for probe dns lookup in seconds
# TYPE probe_dns_lookup_time_seconds gauge
probe_dns_lookup_time_seconds 0.001299143
# HELP probe_duration_seconds Returns how long the probe took to complete in seconds
# TYPE probe_duration_seconds gauge
probe_duration_seconds 0.001958731
# HELP probe_icmp_duration_seconds Duration of icmp request by phase
# TYPE probe_icmp_duration_seconds gauge
probe_icmp_duration_seconds{phase="resolve"} 0.001299143
probe_icmp_duration_seconds{phase="rtt"} 0
probe_icmp_duration_seconds{phase="setup"} 0.000181367
# HELP probe_ip_addr_hash Specifies the hash of IP address. It's useful to detect if the IP address changes.
# TYPE probe_ip_addr_hash gauge
probe_ip_addr_hash 3.917031857e+09
# HELP probe_ip_protocol Specifies whether probe ip protocol is IP4 or IP6
# TYPE probe_ip_protocol gauge
probe_ip_protocol 6
# HELP probe_success Displays whether or not the probe was a success
# TYPE probe_success gauge
probe_success 0
[root@linux010 ~]#
パラメタ変更
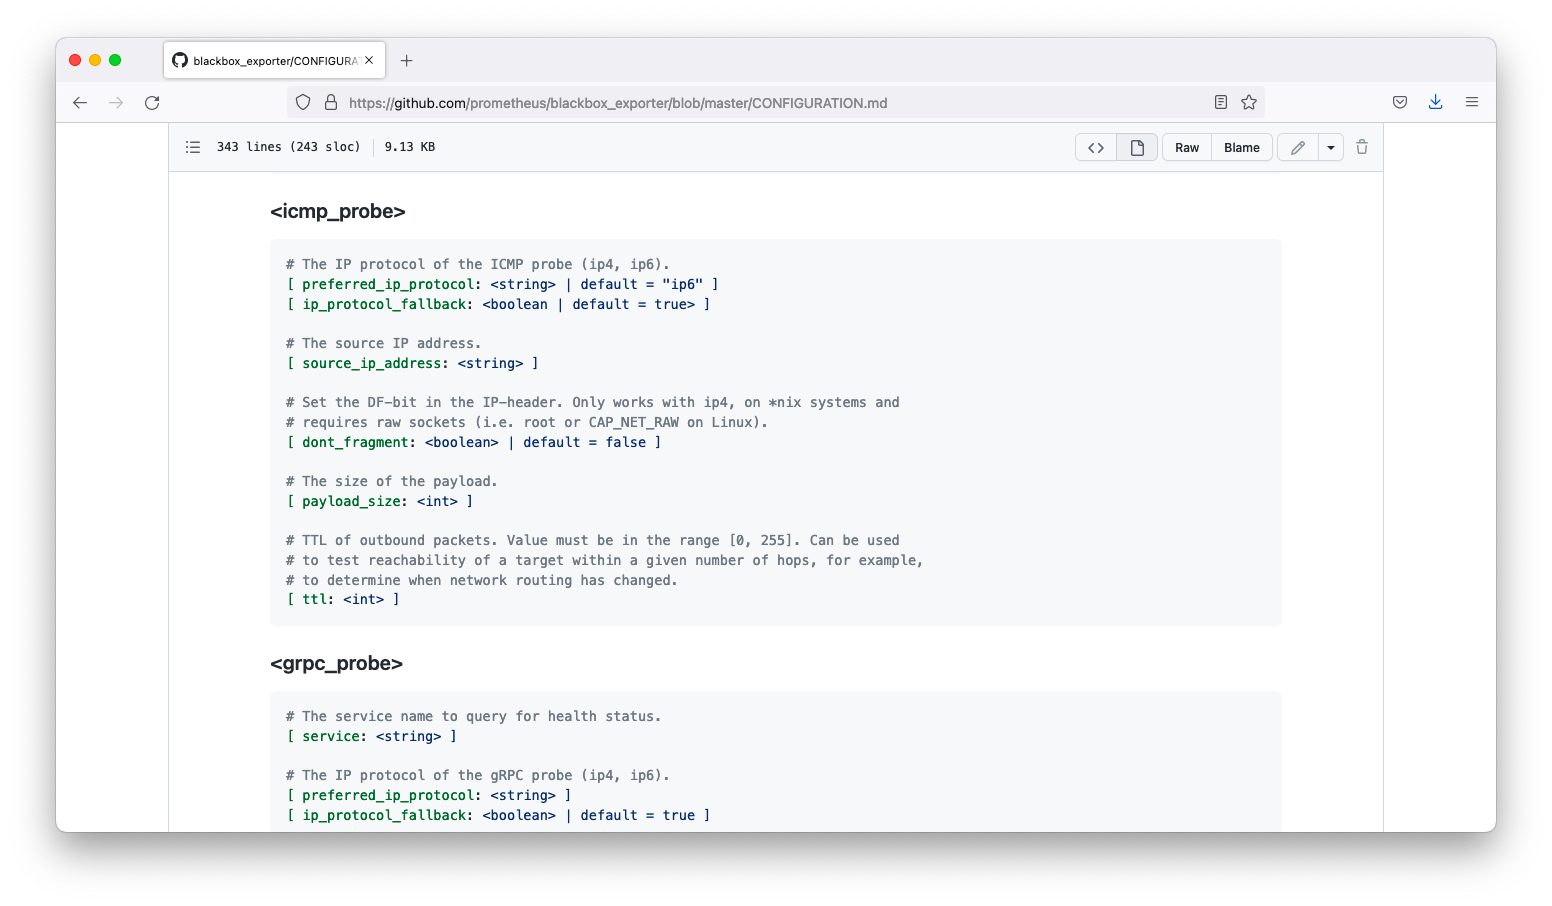
Blackbox Exporterはモジュール毎にパラメタを変更できます。どのようなパラメタを指定できるかは、GitHubの「CONFIGURATION.md」を参照ください。preferred_ip_protocolやip_protocol_fallbackなどのパラメタを指定できます。例えば、jumbo frameのテストをしたいならば、dont_fragmentとpayload_sizeを指定すると良いでしょう。
/etc/prometheus/blackbox.ymlのデフォルト設定は以下の通りです。
modules:

  <中略>

  icmp:
    prober: icmp
デフォルト設定で要件を満たさない場合の設定変更例を以下に示します。例えば、IPv4/IPv6を明示指定したい場合やJumbo frame(MTU 9000)の疎通可否を調べたい場合は以下のように変更します。
modules:

  <omitted>

  icmp_v4:
    prober: icmp
    icmp:
      preferred_ip_protocol: ip4
  icmp_v6:
    prober: icmp
    icmp:
      preferred_ip_protocol: ip6
  icmp_jumbo:
    prober: icmp
    icmp:
      dont_fragment: true
      payload_size: 8972
Jumbo frameの疎通確認操作例は以下のようになります。「probe_success 1」と表示される事を確認します。
[root@linux010 ~]# curl 'http://localhost:9115/probe?module=icmp_jumbo&target=172.16.1.20'

  <omitted>

# HELP probe_success Displays whether or not the probe was a success
# TYPE probe_success gauge
probe_success 1
[root@linux010 ~]#
prometheusの設定例
/etc/prometheus/prometheus.ymlの設定例を以下に示します。
scrape_configs:
  - job_name: 'blackbox_icmp_v4'
    metrics_path: /probe
    params:
      module: [icmp_v4]
    static_configs:
      - targets:
        - www.google.co.jp
    relabel_configs:
      - source_labels: [__address__]
        target_label: __param_target
      - source_labels: [__param_target]
        target_label: instance
      - target_label: __address__
        replacement: 127.0.0.1:9115
  - job_name: 'blackbox_icmp_jumbo'
    metrics_path: /probe
    params:
      module: [icmp_jumbo]
    static_configs:
      - targets:
        - 172.16.1.20
        - 172.16.1.30
    relabel_configs:
      - source_labels: [__address__]
        target_label: __param_target
      - source_labels: [__param_target]
        target_label: instance
      - target_label: __address__
        replacement: 127.0.0.1:9115
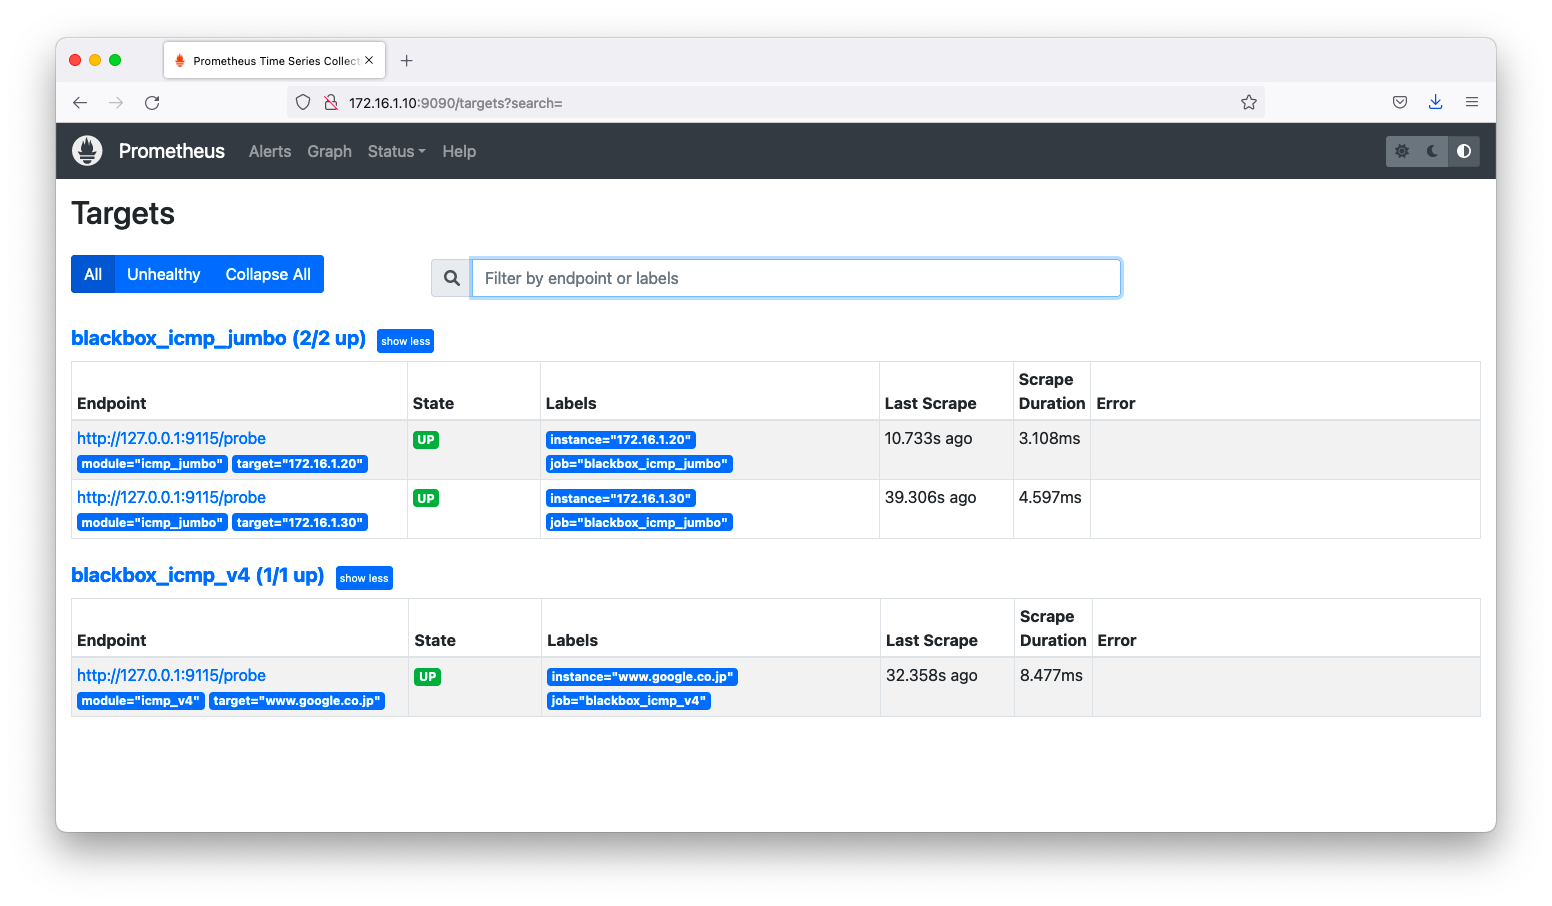
prometheusの設定反映後、targets画面(http://<IPアドレス>9090/targes)を閲覧すると、確かに監視できる事を確認できます。
TCP
デバッグ操作
Blackbox Exporterに対して、クエリ文字列でモジュール名と監視対象ホストを指定すると、監視結果が出力されます。
例えば、172.16.1.20のtcp22を監視したいならば、以下のようなクエリ文字列を指定します。
[root@linux010 ~]# curl 'http://localhost:9115/probe?module=tcp_connect&target=172.16.1.20:22'
# HELP probe_dns_lookup_time_seconds Returns the time taken for probe dns lookup in seconds
# TYPE probe_dns_lookup_time_seconds gauge
probe_dns_lookup_time_seconds 2.2317e-05
# HELP probe_duration_seconds Returns how long the probe took to complete in seconds
# TYPE probe_duration_seconds gauge
probe_duration_seconds 0.000784966
# HELP probe_failed_due_to_regex Indicates if probe failed due to regex
# TYPE probe_failed_due_to_regex gauge
probe_failed_due_to_regex 0
# HELP probe_ip_addr_hash Specifies the hash of IP address. It's useful to detect if the IP address changes.
# TYPE probe_ip_addr_hash gauge
probe_ip_addr_hash 1.477977276e+09
# HELP probe_ip_protocol Specifies whether probe ip protocol is IP4 or IP6
# TYPE probe_ip_protocol gauge
probe_ip_protocol 4
# HELP probe_success Displays whether or not the probe was a success
# TYPE probe_success gauge
probe_success 1
[root@linux010 ~]#
パラメタ変更
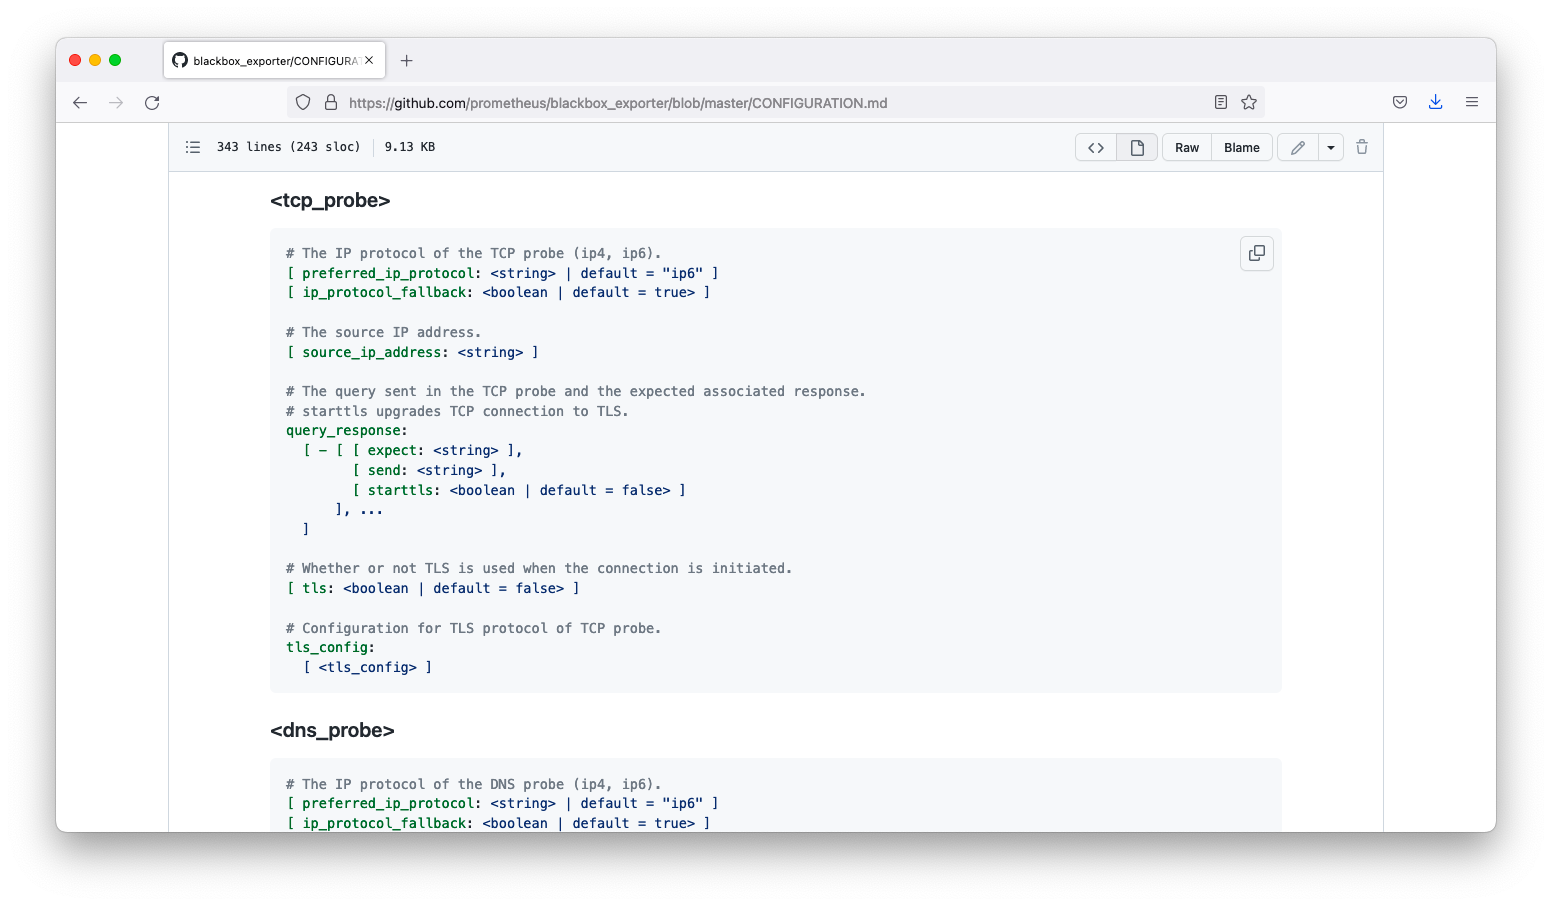
Blackbox Exporterはモジュール毎にパラメタを変更できます。どのようなパラメタを指定できるかは、GitHubの「CONFIGURATION.md」を参照ください。preferred_ip_protocolやip_protocol_fallbackなどのパラメタを指定できます。
/etc/prometheus/blackbox.ymlのデフォルト設定は以下の通りです。
modules:

  <omitted>

  tcp_connect:
    prober: tcp

  <omitted>

  ssh_banner:
    prober: tcp
    tcp:
      query_response:
      - expect: "^SSH-2.0-"
      - send: "SSH-2.0-blackbox-ssh-check"
tcpモジュールは特に仕様変更しなければならない業務要件が思い当たらないため、デフォルト設定の解説をします。Blackbox Exporterはtcpモジュールにquery_responseパラメタを指定すると、応答する文字列のチェックが出来ます。
簡単な実験をしてみましょう。ncコマンドまたはtelnetコマンドでsshd(tcp22)に接続してみましょう。すると、以下操作例のように「SSH-2.0-OpenSSH_8.0」のような文字列が返される事が分かります。
[root@linux010 ~]# nc 172.16.1.20 22
SSH-2.0-OpenSSH_8.0
^C
[root@linux010 ~]#
この「SSH-2.0-OpenSSH_8.0」の先頭部分「SSH-2.0-」が返ってくるかどうかチェックするには以下のように指定します。なお、sendパラメタは指定必須ではありませんが、このような情報を付加しておくと、パケットキャプチャから通信用途が推定できるので切り分けが楽になるでしょう。
modules:
  ssh_banner:
    prober: tcp
    tcp:
      query_response:
      - expect: "^SSH-2.0-"
      - send: "SSH-2.0-blackbox-ssh-check"
prometheusの設定例
/etc/prometheus/prometheus.ymlの設定例を以下に示します。
scrape_configs:
  - job_name: 'tcp_connect'
    metrics_path: /probe
    params:
      module: [tcp_connect]
    static_configs:
      - targets:
        - 172.16.1.20:80
        - 172.16.1.30:80
    relabel_configs:
      - source_labels: [__address__]
        target_label: __param_target
      - source_labels: [__param_target]
        target_label: instance
      - target_label: __address__
        replacement: 127.0.0.1:9115
  - job_name: 'ssh_banner'
    metrics_path: /probe
    params:
      module: [ssh_banner]
    static_configs:
      - targets:
        - 172.16.1.20:22
        - 172.16.1.30:22
    relabel_configs:
      - source_labels: [__address__]
        target_label: __param_target
      - source_labels: [__param_target]
        target_label: instance
      - target_label: __address__
        replacement: 127.0.0.1:9115
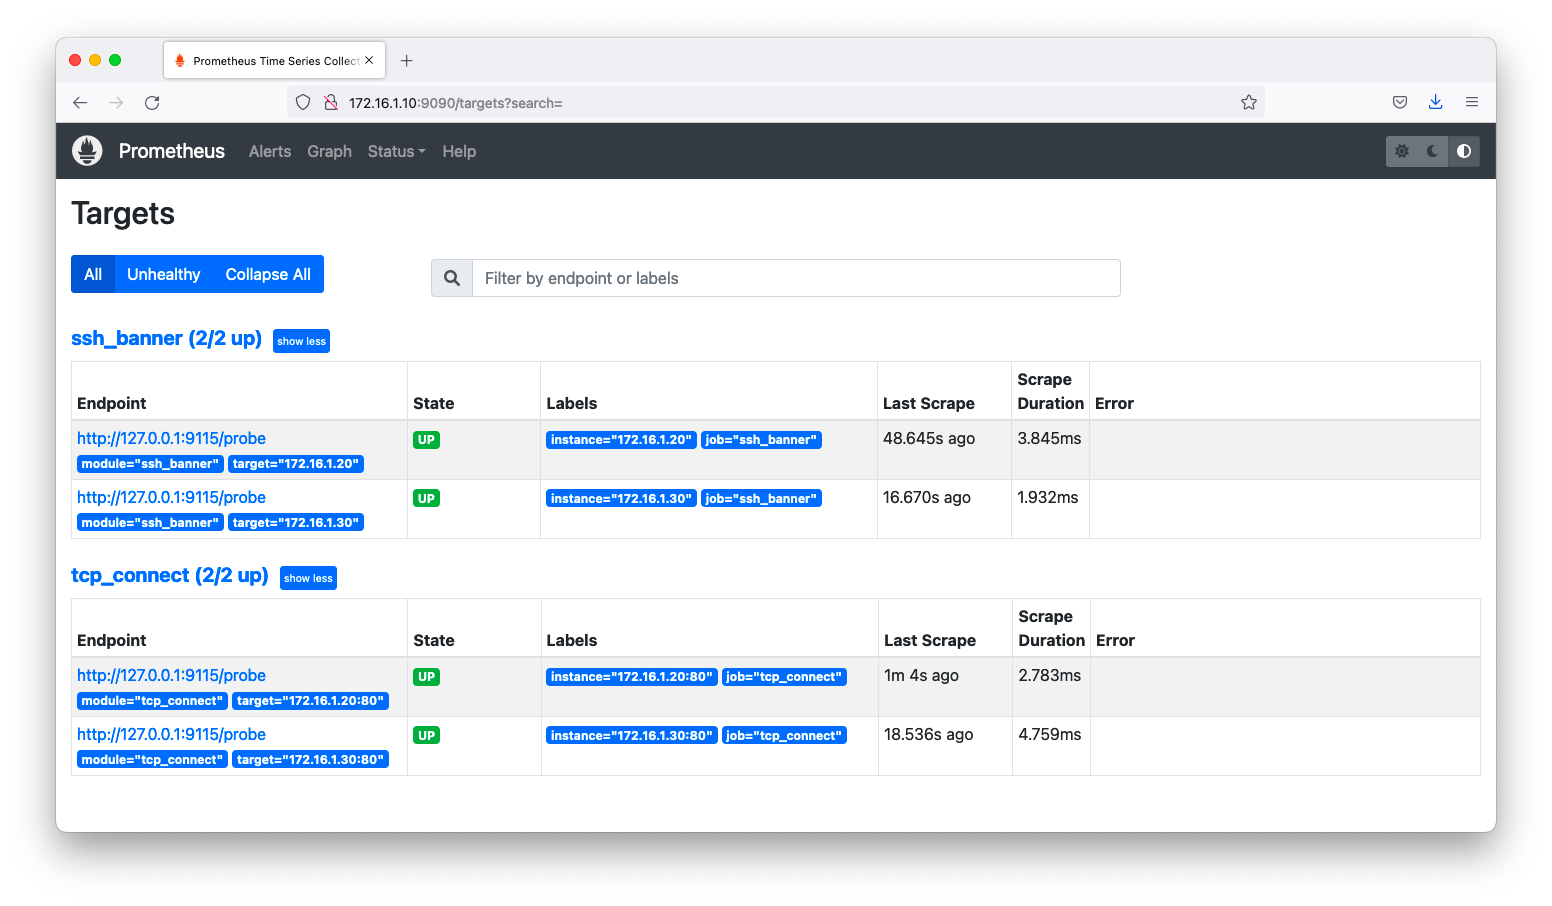
prometheusの設定反映後、targets画面(http://<IPアドレス>9090/targes)を閲覧すると、確かに監視できる事を確認できます。
HTTP
デバッグ操作
Blackbox Exporterに対して、クエリ文字列でモジュール名と監視対象ホストを指定すると、監視結果が出力されます。
例えば、172.16.1.20のtcp22を監視したいならば、以下のようなクエリ文字列を指定します。
[root@linux010 ~]# curl 'http://localhost:9115/probe?module=http_2xx&target=http://172.16.1.20/'
# HELP probe_dns_lookup_time_seconds Returns the time taken for probe dns lookup in seconds
# TYPE probe_dns_lookup_time_seconds gauge
probe_dns_lookup_time_seconds 3.2208e-05
# HELP probe_duration_seconds Returns how long the probe took to complete in seconds
# TYPE probe_duration_seconds gauge
probe_duration_seconds 0.002831336
# HELP probe_failed_due_to_regex Indicates if probe failed due to regex
# TYPE probe_failed_due_to_regex gauge
probe_failed_due_to_regex 0
# HELP probe_http_content_length Length of http content response
# TYPE probe_http_content_length gauge
probe_http_content_length 3429
# HELP probe_http_duration_seconds Duration of http request by phase, summed over all redirects
# TYPE probe_http_duration_seconds gauge
probe_http_duration_seconds{phase="connect"} 0.00062448
probe_http_duration_seconds{phase="processing"} 0.000892947
probe_http_duration_seconds{phase="resolve"} 3.2208e-05
probe_http_duration_seconds{phase="tls"} 0
probe_http_duration_seconds{phase="transfer"} 0.000360388
# HELP probe_http_last_modified_timestamp_seconds Returns the Last-Modified HTTP response header in unixtime
# TYPE probe_http_last_modified_timestamp_seconds gauge
probe_http_last_modified_timestamp_seconds 1.623316143e+09
# HELP probe_http_redirects The number of redirects
# TYPE probe_http_redirects gauge
probe_http_redirects 0
# HELP probe_http_ssl Indicates if SSL was used for the final redirect
# TYPE probe_http_ssl gauge
probe_http_ssl 0
# HELP probe_http_status_code Response HTTP status code
# TYPE probe_http_status_code gauge
probe_http_status_code 200
# HELP probe_http_uncompressed_body_length Length of uncompressed response body
# TYPE probe_http_uncompressed_body_length gauge
probe_http_uncompressed_body_length 3429
# HELP probe_http_version Returns the version of HTTP of the probe response
# TYPE probe_http_version gauge
probe_http_version 1.1
# HELP probe_ip_addr_hash Specifies the hash of IP address. It's useful to detect if the IP address changes.
# TYPE probe_ip_addr_hash gauge
probe_ip_addr_hash 1.477977276e+09
# HELP probe_ip_protocol Specifies whether probe ip protocol is IP4 or IP6
# TYPE probe_ip_protocol gauge
probe_ip_protocol 4
# HELP probe_success Displays whether or not the probe was a success
# TYPE probe_success gauge
probe_success 1
[root@linux010 ~]#
パラメタ変更
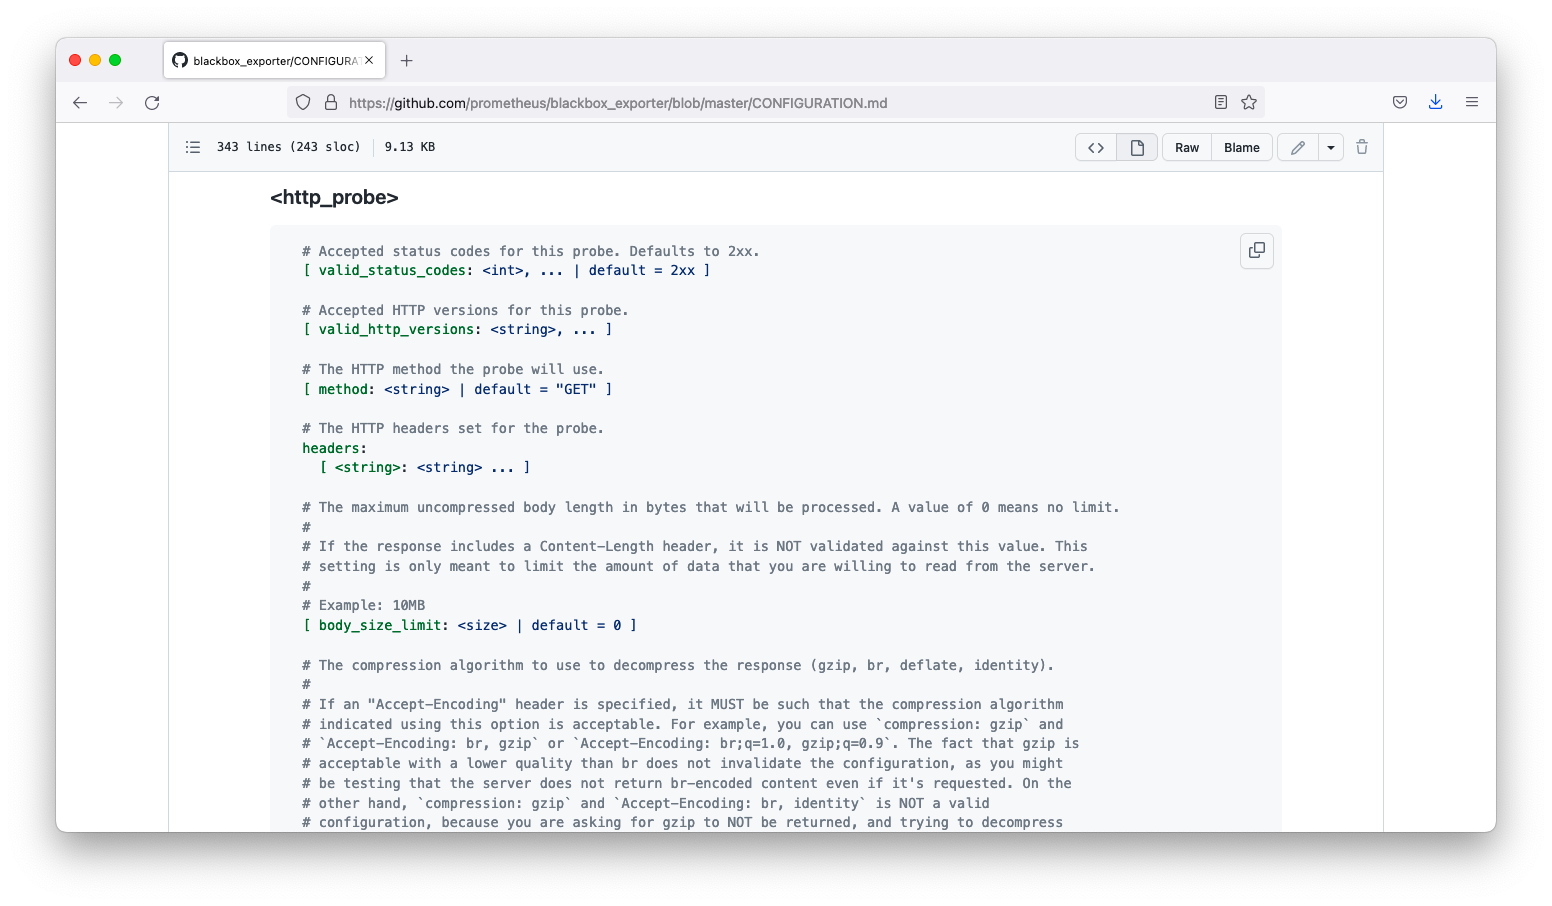
Blackbox Exporterはモジュール毎にパラメタを変更できます。どのようなパラメタを指定できるかは、GitHubの「CONFIGURATION.md」を参照ください。valid_status_codesやmethodなどのパラメタを指定できます。
/etc/prometheus/blackbox.ymlのデフォルト設定は以下の通りです。
modules:
  http_2xx:
    prober: http
  http_post_2xx:
    prober: http
    http:
      method: POST

  <omitted>
もし、「ステータスコード」「SSL必須」「Bodyに含まれる文字れる」などをチェックしたい場合は以下のように指定します。
modules:
  https_yahoo:
    prober: http
    http:
      valid_status_codes: [200]
      fail_if_not_ssl: true
      fail_if_body_not_matches_regexp:
        - Yahoo
        - PayPay

  <omitted>
prometheusの設定例
/etc/prometheus/prometheus.ymlの設定例を以下に示します。
scrape_configs:
  - job_name: 'https_yahoo'
    metrics_path: /probe
    params:
      module: [https_yahoo]
    static_configs:
      - targets:
        - https://www.yahoo.co.jp/
        - https://shopping.yahoo.co.jp/
    relabel_configs:
      - source_labels: [__address__]
        target_label: __param_target
      - source_labels: [__param_target]
        target_label: instance
      - target_label: __address__
        replacement: 127.0.0.1:9115
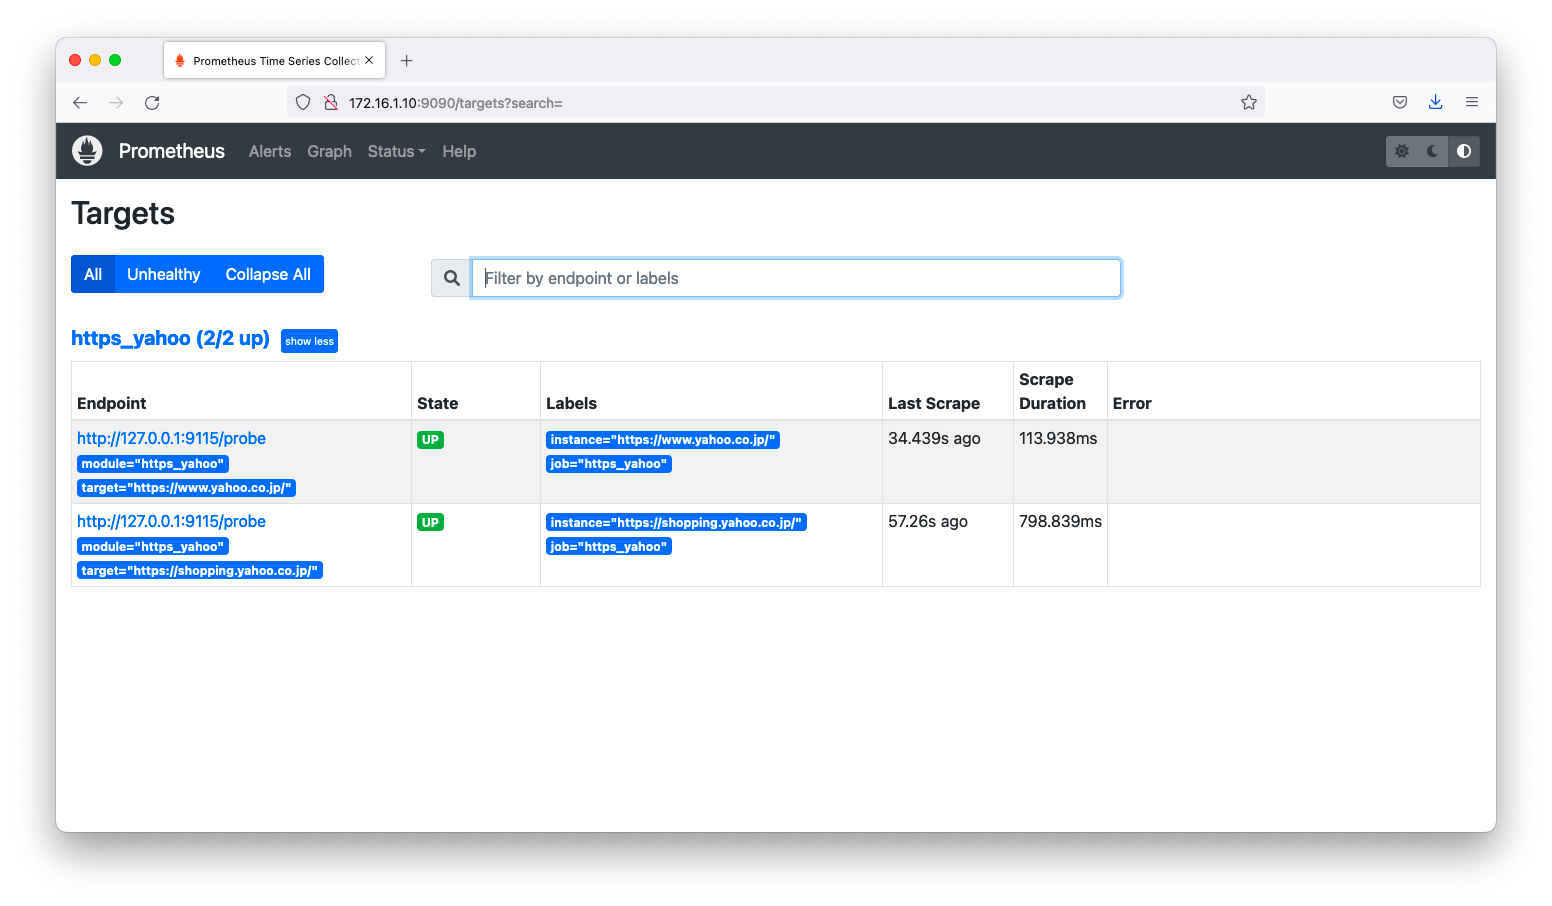
prometheusの設定反映後、targets画面(http://<IPアドレス>9090/targes)を閲覧すると、確かに監視できる事を確認できます。