PrometheusはExporterと呼ばれるメトリック情報を公開するコンポーネントから情報を収集します。Exporterは前述の説明で紹介した「Node Exporter」以外にも様々なメトリックを公開するものがあります。もし、監視したいソフトウェアのExporterが存在しないならば、容易に自作する事もできます。ここでは、既存のExporterの使用感を掴むために、OfficialなExporterであるHAProxy exporterの使い方を説明します。
前提
参照資料
動作確認済環境
- Rocky Linux 8.6
- Prometheus 2.36.2
- haproxy 1.8.27
- haproxy_exporte 0.13.0
構成図
Unix Socketを使用する場合(同一OSの場合)
HAProxyとhaproxy_exporterが同一OSにインストールされる場合の構成を以下に図示します。この構成の場合、HAProxyとhaproxy_exporterの間はUnix Socketで通信する事ができます。
+----------------+ +------------------+
| linux010       | | linux020         |
| 172.16.1.10/24 | | 172.16.1.20/24   |
|                | |                  |
|                | | HAProxy          |
| prometheus     | | haproxy_exporter |
+----------------+ +------------------+
tcpを使用する場合(別OSの場合)
HAProxyとhaproxy_exporterが別OSにインストールされる場合の構成を以下に図示します。この構成の場合、HAProxyとhaproxy_exporterの間はtcpで通信する事ができます。
+------------------+ +----------------+
| linux010         | | linux020       |
| 172.16.1.10/24   | | 172.16.1.20/24 |
|                  | |                |
| haproxy_exporter | | HAProxy        |
| prometheus       | |                |
+------------------+ +----------------+
Unix Socketを使用する場合(同一OSの場合)
HAProxyのインストール
HAProxyをインストールします。
dnf install haproxy
HAProxyを起動します。
systemctl enable haproxy.service --now
HAProxy exporterはHAProxyのstatsページをスクレイプしますので、statページのURLを調査します。/etc/haproxy/haproxy.cfgを見てstatsページのデフォルト設定を調査します。
[root@linux020 ~]# view /etc/haproxy/haproxy.cfg

  <omitted>

    # turn on stats unix socket
    stats socket /var/lib/haproxy/stats

  <omitted>
上記の場合は、Unix Socketの/var/lib/haproxy/statsで待ち受けている事が分かりますので、このURLに対してHA proxyの情報取得が可能かどうかを調査します。
情報を取得する方法はいくつかありますが、「HA Proxy 公式ドキュメント」ではsocatコマンドを使った方法を紹介しています。もし、socatがインストールされていないならば、まずはsocatコマンドをインストールします。
dnf install socat
以下のように「help」と入力すれば、ヘルプが表示されます。
[root@linux020 ~]# socat /var/lib/haproxy/stats - <<< "help"
Unknown command. Please enter one of the following commands only :
  help           : this message
  prompt         : toggle interactive mode with prompt
  quit           : disconnect

  <omitted>

  clear counters : clear max statistics counters (add 'all' for all counters)
  show info      : report information about the running process [json|typed]
  show stat      : report counters for each proxy and server [json|typed]
  show schema json : report schema used for stats
  show startup-logs : report logs emitted during HAProxy startup

  <omitted>
「show stat」と入力すれば、統計情報が見れます。
[root@linux020 ~]# socat /var/lib/haproxy/stats - <<< "show stat"
# pxname,svname,qcur,qmax,scur,smax,slim,stot,bin,bout,dreq,dresp,ereq,econ,eresp,wretr,wredis,status,weight,act,bck,chkfail,chkdown,lastchg,downtime,qlimit,pid,iid,sid,throttle,lbtot,tracked,type,rate,rate_lim,rate_max,check_status,check_code,check_duration,hrsp_1xx,hrsp_2xx,hrsp_3xx,hrsp_4xx,hrsp_5xx,hrsp_other,hanafail,req_rate,req_rate_max,req_tot,cli_abrt,srv_abrt,comp_in,comp_out,comp_byp,comp_rsp,lastsess,last_chk,last_agt,qtime,ctime,rtime,ttime,agent_status,agent_code,agent_duration,check_desc,agent_desc,check_rise,check_fall,check_health,agent_rise,agent_fall,agent_health,addr,cookie,mode,algo,conn_rate,conn_rate_max,conn_tot,intercepted,dcon,dses,
main,FRONTEND,,,0,0,3000,0,0,0,0,0,0,,,,,OPEN,,,,,,,,,1,2,0,,,,0,0,0,0,,,,0,0,0,0,0,0,,0,0,0,,,0,0,0,0,,,,,,,,,,,,,,,,,,,,,http,,0,0,0,0,0,0,
static,static,0,0,0,0,,0,0,0,,0,,0,0,0,0,DOWN,1,1,0,1,1,1875,1875,,1,3,1,,0,,2,0,,0,L4CON,,0,0,0,0,0,0,0,,,,,0,0,,,,,-1,Connection refused,,0,0,0,0,,,,Layer4 connection problem,,2,3,0,,,,127.0.0.1:4331,,http,,,,,,,,
static,BACKEND,0,0,0,0,300,0,0,0,0,0,,0,0,0,0,DOWN,0,0,0,,1,1875,1875,,1,3,0,,0,,1,0,,0,,,,0,0,0,0,0,0,,,,0,0,0,0,0,0,0,-1,,,0,0,0,0,,,,,,,,,,,,,,http,roundrobin,,,,,,,
app,app1,0,0,0,0,,0,0,0,,0,,0,0,0,0,DOWN,1,1,0,1,1,1875,1875,,1,4,1,,0,,2,0,,0,L4CON,,0,0,0,0,0,0,0,,,,,0,0,,,,,-1,Connection refused,,0,0,0,0,,,,Layer4 connection problem,,2,3,0,,,,127.0.0.1:5001,,http,,,,,,,,
app,app2,0,0,0,0,,0,0,0,,0,,0,0,0,0,DOWN,1,1,0,1,1,1874,1874,,1,4,2,,0,,2,0,,0,L4CON,,0,0,0,0,0,0,0,,,,,0,0,,,,,-1,General socket error (Permission denied),,0,0,0,0,,,,Layer4 connection problem,,2,3,0,,,,127.0.0.1:5002,,http,,,,,,,,
app,app3,0,0,0,0,,0,0,0,,0,,0,0,0,0,DOWN,1,1,0,1,1,1874,1874,,1,4,3,,0,,2,0,,0,L4CON,,0,0,0,0,0,0,0,,,,,0,0,,,,,-1,Connection refused,,0,0,0,0,,,,Layer4 connection problem,,2,3,0,,,,127.0.0.1:5003,,http,,,,,,,,
app,app4,0,0,0,0,,0,0,0,,0,,0,0,0,0,DOWN,1,1,0,1,1,1873,1873,,1,4,4,,0,,2,0,,0,L4CON,,0,0,0,0,0,0,0,,,,,0,0,,,,,-1,Connection refused,,0,0,0,0,,,,Layer4 connection problem,,2,3,0,,,,127.0.0.1:5004,,http,,,,,,,,
app,BACKEND,0,0,0,0,300,0,0,0,0,0,,0,0,0,0,DOWN,0,0,0,,1,1873,1873,,1,4,0,,0,,1,0,,0,,,,0,0,0,0,0,0,,,,0,0,0,0,0,0,0,-1,,,0,0,0,0,,,,,,,,,,,,,,http,roundrobin,,,,,,,
HAProxy exporterのインストール
HAProxy exporterのインストール方法はいくつかあります。このページでは「公式サイト」や「GitHub」で紹介されていないパッケージを用いた手法を紹介します。
Prometheusのリポジトリを登録します。
cat << 'EOF' > /etc/yum.repos.d/prometheus.repo
[prometheus]
name=prometheus
baseurl=https://packagecloud.io/prometheus-rpm/release/el/$releasever/$basearch
repo_gpgcheck=1
enabled=1
gpgkey=https://packagecloud.io/prometheus-rpm/release/gpgkey
       https://raw.githubusercontent.com/lest/prometheus-rpm/master/RPM-GPG-KEY-prometheus-rpm
gpgcheck=1
metadata_expire=300
EOF
HAProxy exporterをインストールします。
dnf install haproxy_exporter
パッケージ版の場合は、systemdのお作法に基づいて起動引数が設定されています。/usr/lib/systemd/system/haproxy_exporter.serviceを確認すると、起動引数は/etc/default/haproxy_exporterにHAPROXY_EXPORTER_OPTSという変数が定義する事が分かります。
[root@linux020 ~]# cat /usr/lib/systemd/system/haproxy_exporter.service
# -*- mode: conf -*-

[Unit]
Description=This is a simple server that scrapes HAProxy stats and exports them via HTTP for Prometheus consumption.
Documentation=https://github.com/prometheus/haproxy_exporter
After=network.target

[Service]
EnvironmentFile=-/etc/default/haproxy_exporter
User=prometheus
ExecStart=/usr/bin/haproxy_exporter $HAPROXY_EXPORTER_OPTS
ExecReload=/bin/kill -HUP $MAINPID
Restart=on-failure
RestartSec=5s


[Install]
WantedBy=multi-user.target
[root@linux010 ~]#
デフォルト設定の場合は、statsページのURLはunix:/var/lib/haproxy/statsになっています。デフォルト設定から変更の必要がない事が分かります。
[root@linux020 ~]# cat /etc/default/haproxy_exporter
HAPROXY_EXPORTER_OPTS="--haproxy.scrape-uri=unix:/var/lib/haproxy/stats"
HAProxy exporterを起動します。
systemctl enable haproxy_exporter.service --now
「http://localhost:9101/metrics」にてHAProxyの情報を取得できる事を確認します。
[root@linux020 ~]# curl -s http://localhost:9101/metrics
# HELP go_gc_duration_seconds A summary of the pause duration of garbage collection cycles.
# TYPE go_gc_duration_seconds summary
go_gc_duration_seconds{quantile="0"} 0
go_gc_duration_seconds{quantile="0.25"} 0
go_gc_duration_seconds{quantile="0.5"} 0
go_gc_duration_seconds{quantile="0.75"} 0
go_gc_duration_seconds{quantile="1"} 0
go_gc_duration_seconds_sum 0
go_gc_duration_seconds_count 0

 <omitted>
Prometheusの設定例
/etc/prometheus/prometheus.ymlの設定例は以下の通りです。
scrape_configs:
  - job_name: haproxy
    static_configs:
      - targets:
        - localhost:9101
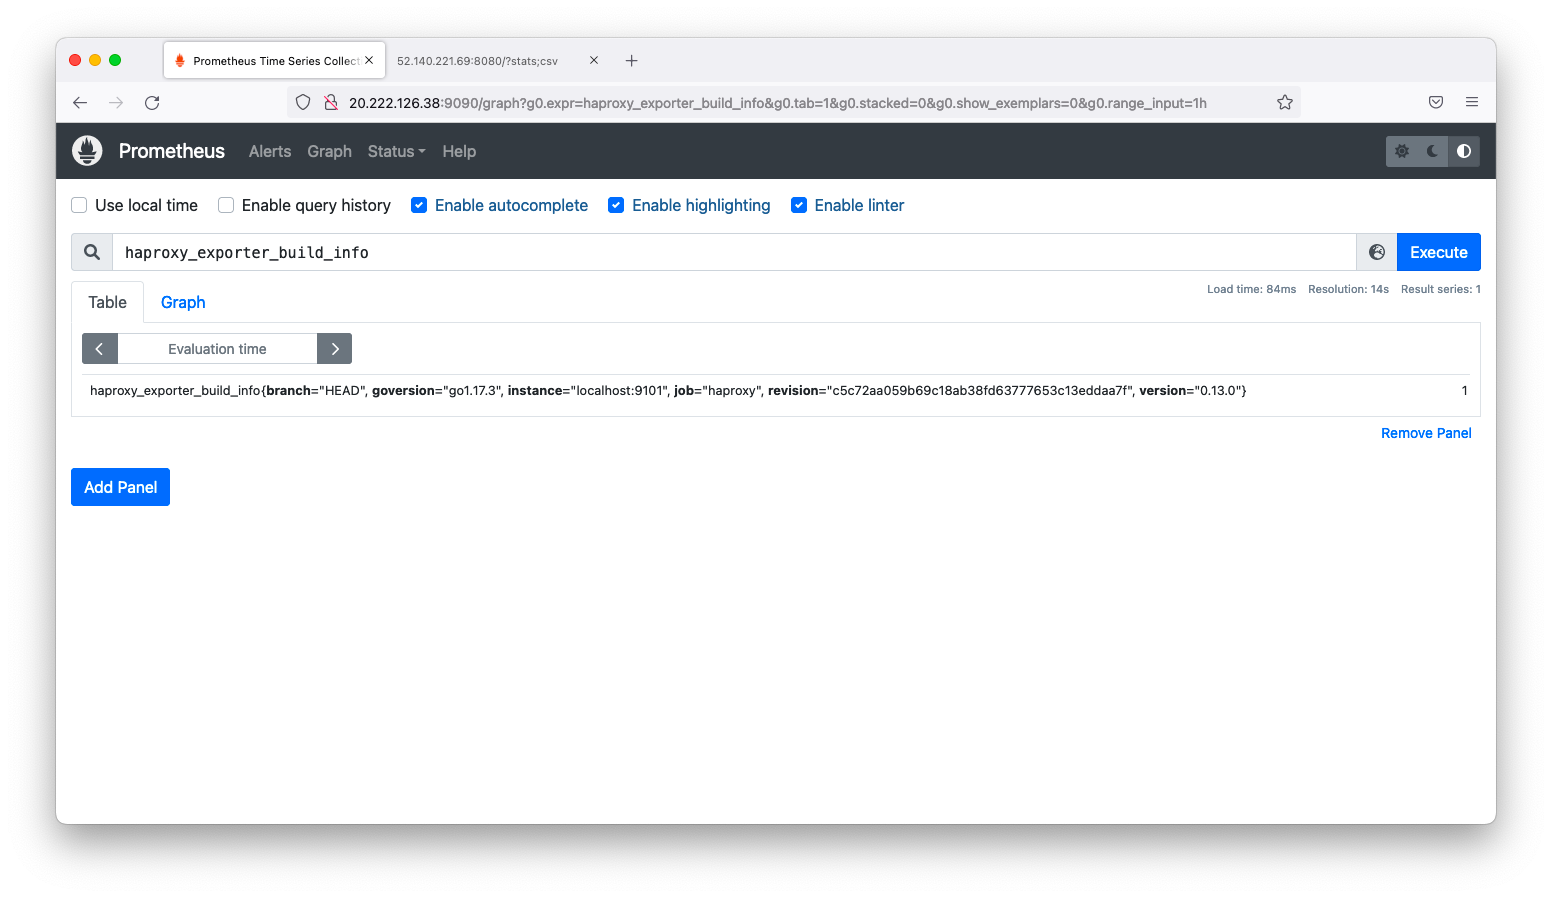
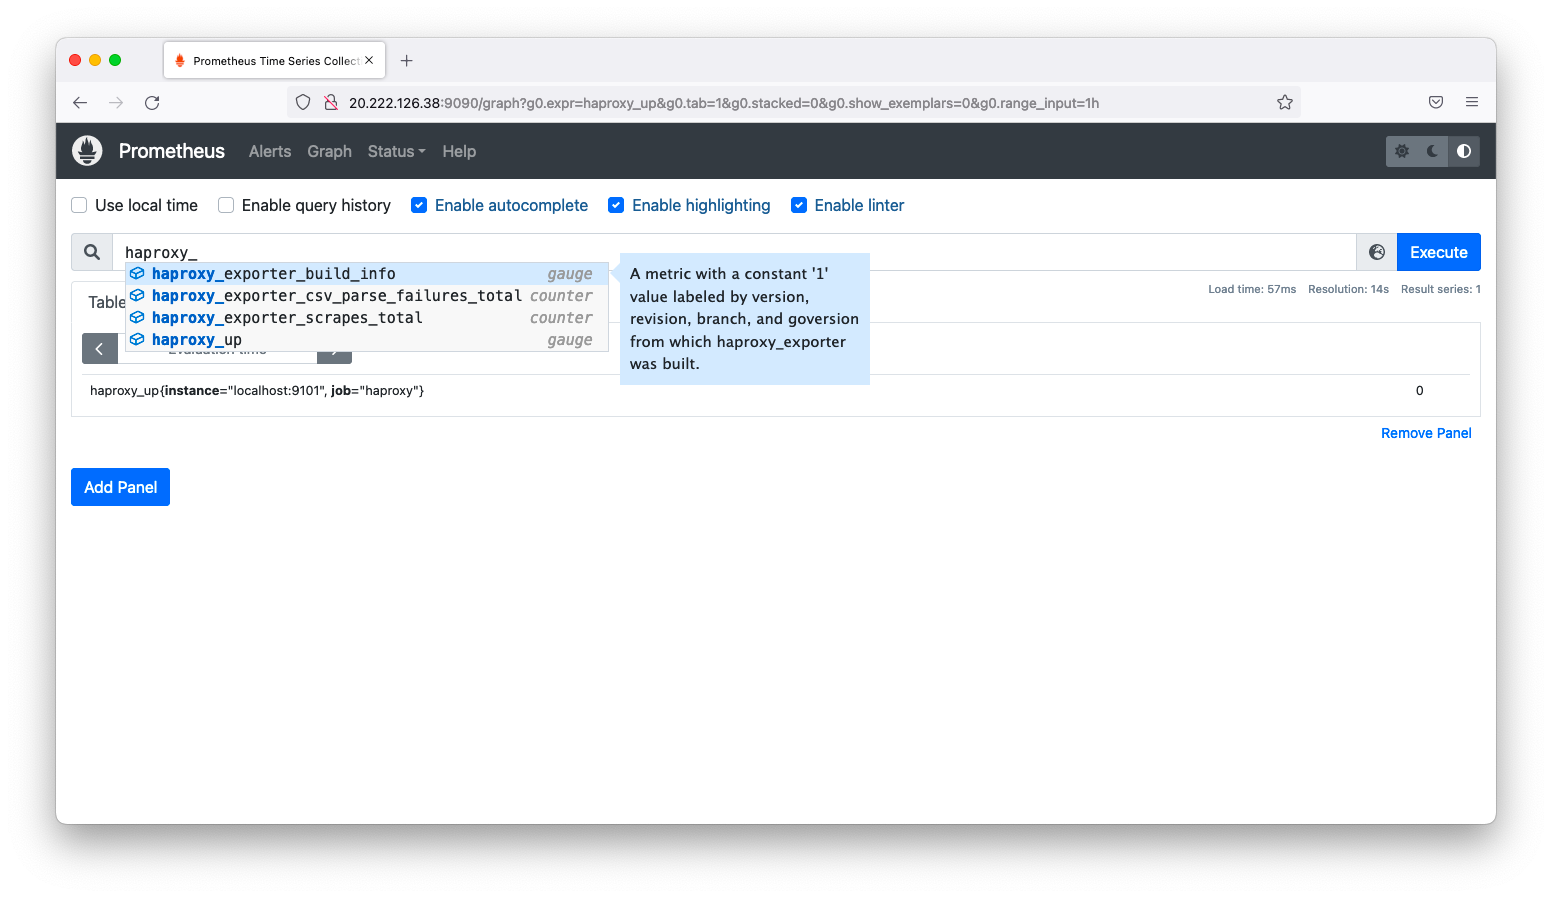
設定後、HAProxyの情報が取得できる事を確認します。
tcpを使用する場合(別OSの場合)
HAProxyのインストール
dnf install haproxy
HAProxy exporterはHAProxyのstatsページをスクレイプします。statsページを別ホストから閲覧できるように設定しましょう。/etc/haproxy/haproxy.cfgを以下のように編集します。
設定を加筆する位置は任意で差し支えございません。
# vi /etc/haproxy/haproxy.cfg

  <omitted>

listen haproxy.stats
    bind *:8080
    mode http
    stats enable
    stats uri /
HAProxyを起動します。
systemctl enable haproxy.service --now
この設定例の場合はtcp8080でstatsページを閲覧できます。curlコマンドよりもブラウザの方が見やすいので、ブラウザで「http://<IPアドレス>:8080/」を閲覧します。
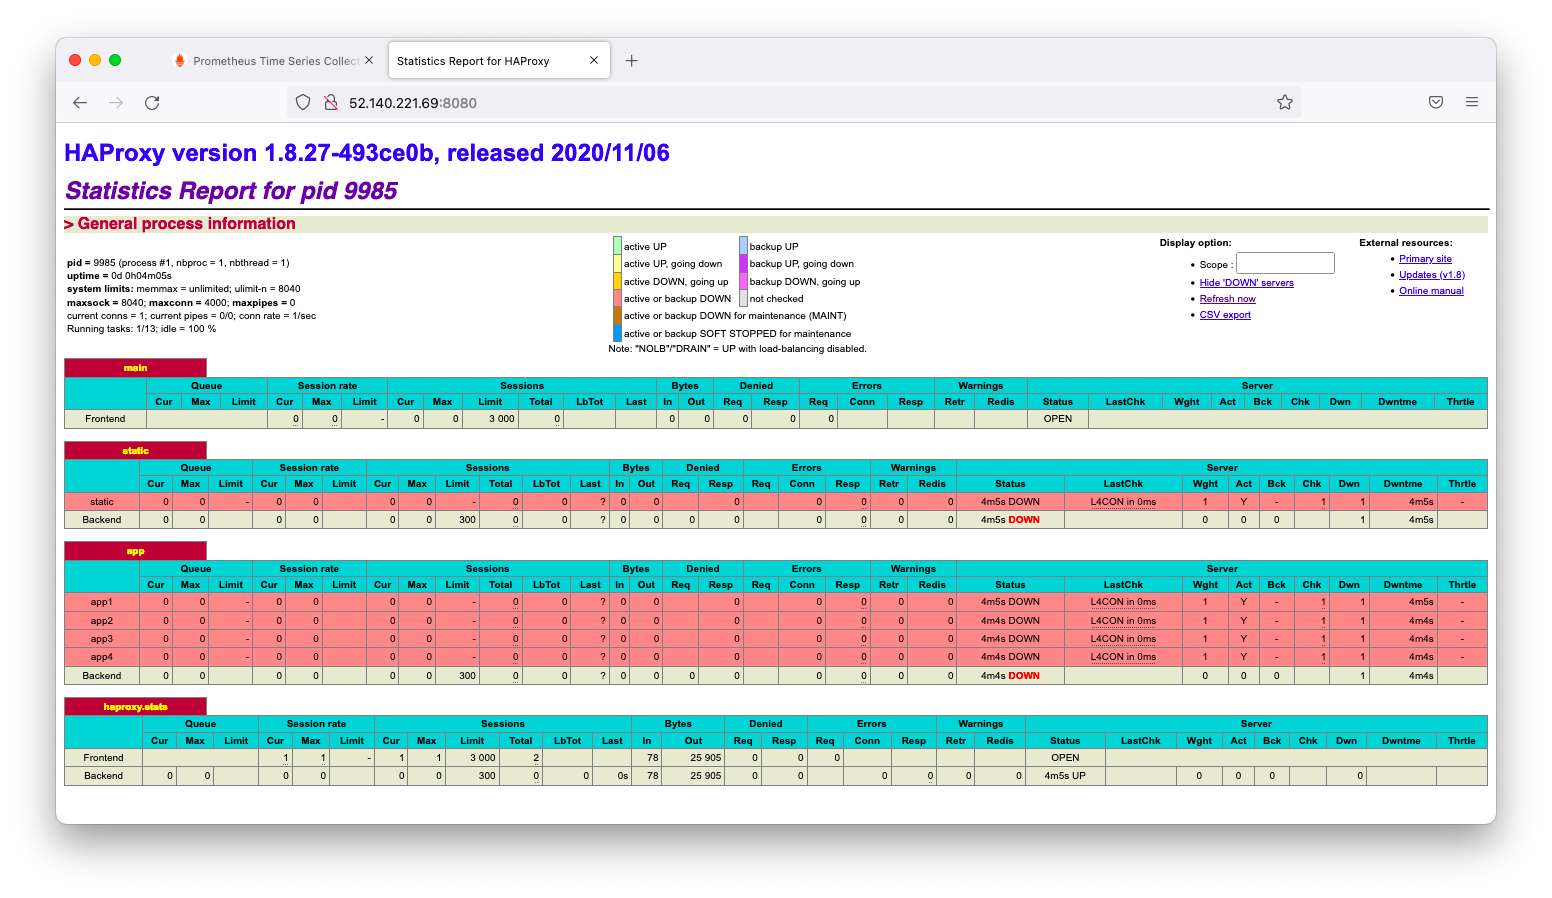
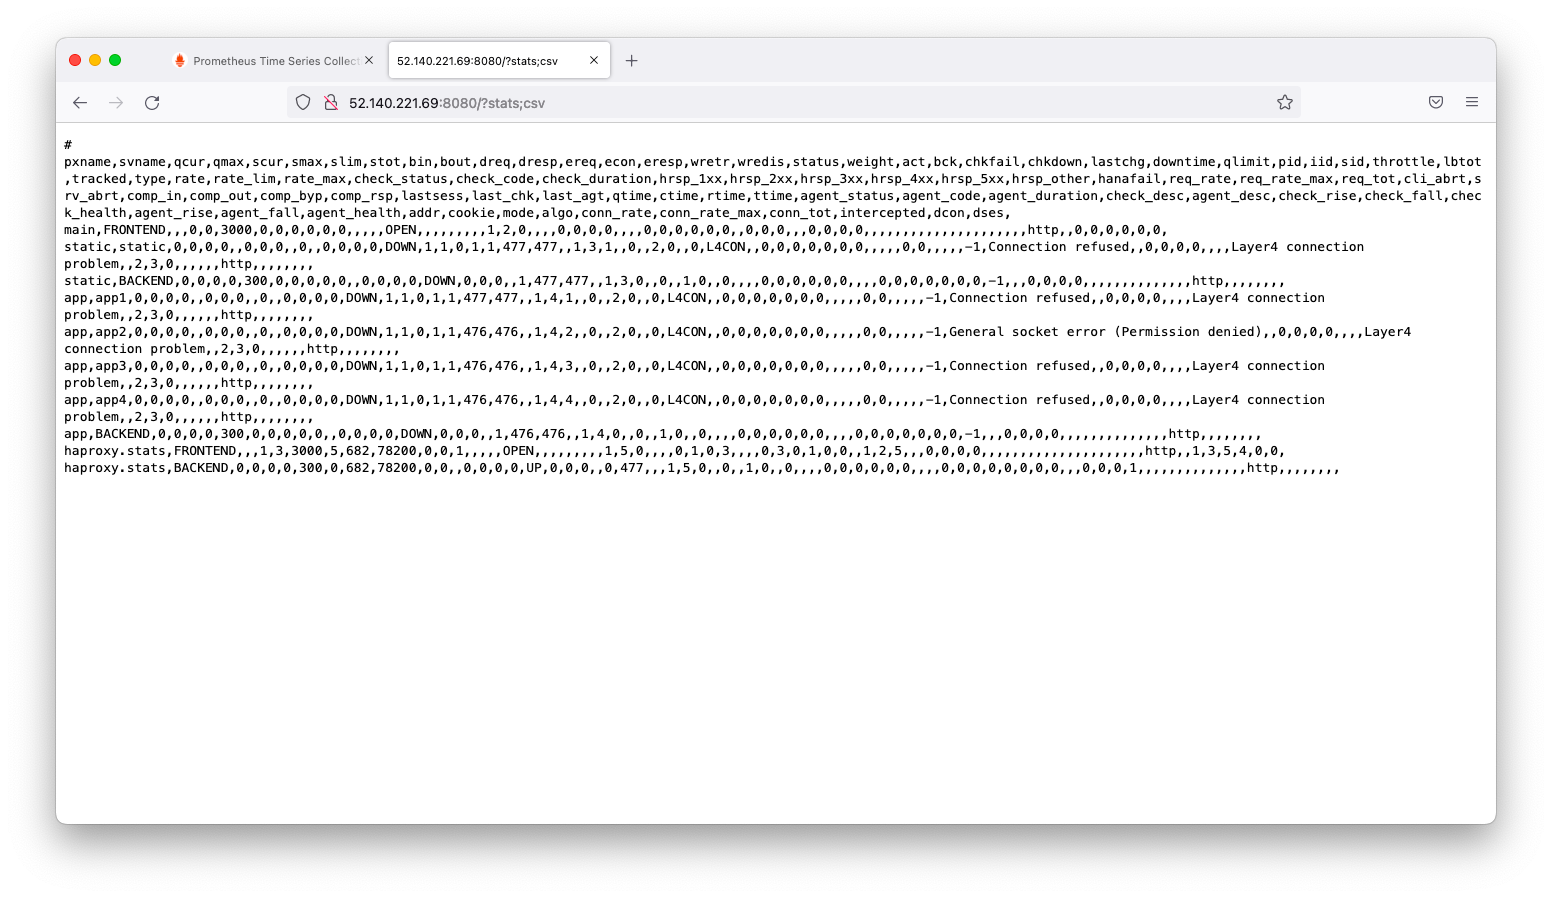
特にクエリ文字列を指定しない場合は上記のような人間が見やすい情報を返します。後続の操作で設定するHAProxy exporterはcsv形式の情報をスクレイプしますので、ブラウザに「http://<IPアドレス>:8080/?stats;csv」を入力しcsv形式の情報を閲覧できるかを確認します。
HAProxy exporterのインストール
statsページが別ホストに存在する場合は、HAProxyの起動引数を以下のように編集します。
デフォルト設定の場合は、statsページのURLはunix:/var/lib/haproxy/statsになっています。デフォルト設定から変更の必要がない事が分かります。
[root@linux010 ~]# vi /etc/default/haproxy_exporter
HAPROXY_EXPORTER_OPTS="--haproxy.scrape-uri=http://172.16.1.20/?stats;csv"
HAProxy exporterを起動します。
systemctl enable haproxy_exporter.service --now
「http://localhost:9101/metrics」にてHAProxyの情報を取得できる事を確認します。
[root@linux010 ~]# curl -s http://localhost:9101/metrics
# HELP go_gc_duration_seconds A summary of the pause duration of garbage collection cycles.
# TYPE go_gc_duration_seconds summary
go_gc_duration_seconds{quantile="0"} 0
go_gc_duration_seconds{quantile="0.25"} 0
go_gc_duration_seconds{quantile="0.5"} 0
go_gc_duration_seconds{quantile="0.75"} 0
go_gc_duration_seconds{quantile="1"} 0
go_gc_duration_seconds_sum 0
go_gc_duration_seconds_count 0

 <omitted>
Prometheusの設定例
/etc/prometheus/prometheus.ymlの設定例は以下の通りです。
scrape_configs:
  - job_name: haproxy
    static_configs:
      - targets:
        - localhost:9101
設定後、HAProxyの情報が取得できる事を確認します。