
Prometheusは大量コンポーネントを監視する事に特化したソフトウェアです。Prometheus単体で使用せず、いくつかのソフトウェアを組み合わせて監視の運用を実現する構成を採用する事もあります。このページではInfluxData社が開発したtelegrafと呼ばれるデータ収集・集計・転送ツールと連携する方法を説明します。
前提
参照資料
動作確認済環境
- Rocky Linux 8.6
- Prometheus 2.36.2
- telegraf 1.23.2
telegraf側の構成
インストール
「InfluxData download page」より最新バージョンのTelegrafのダウンロード方法を確認します。執筆時点(2022年7月)の最新の手順は以下の通りです。
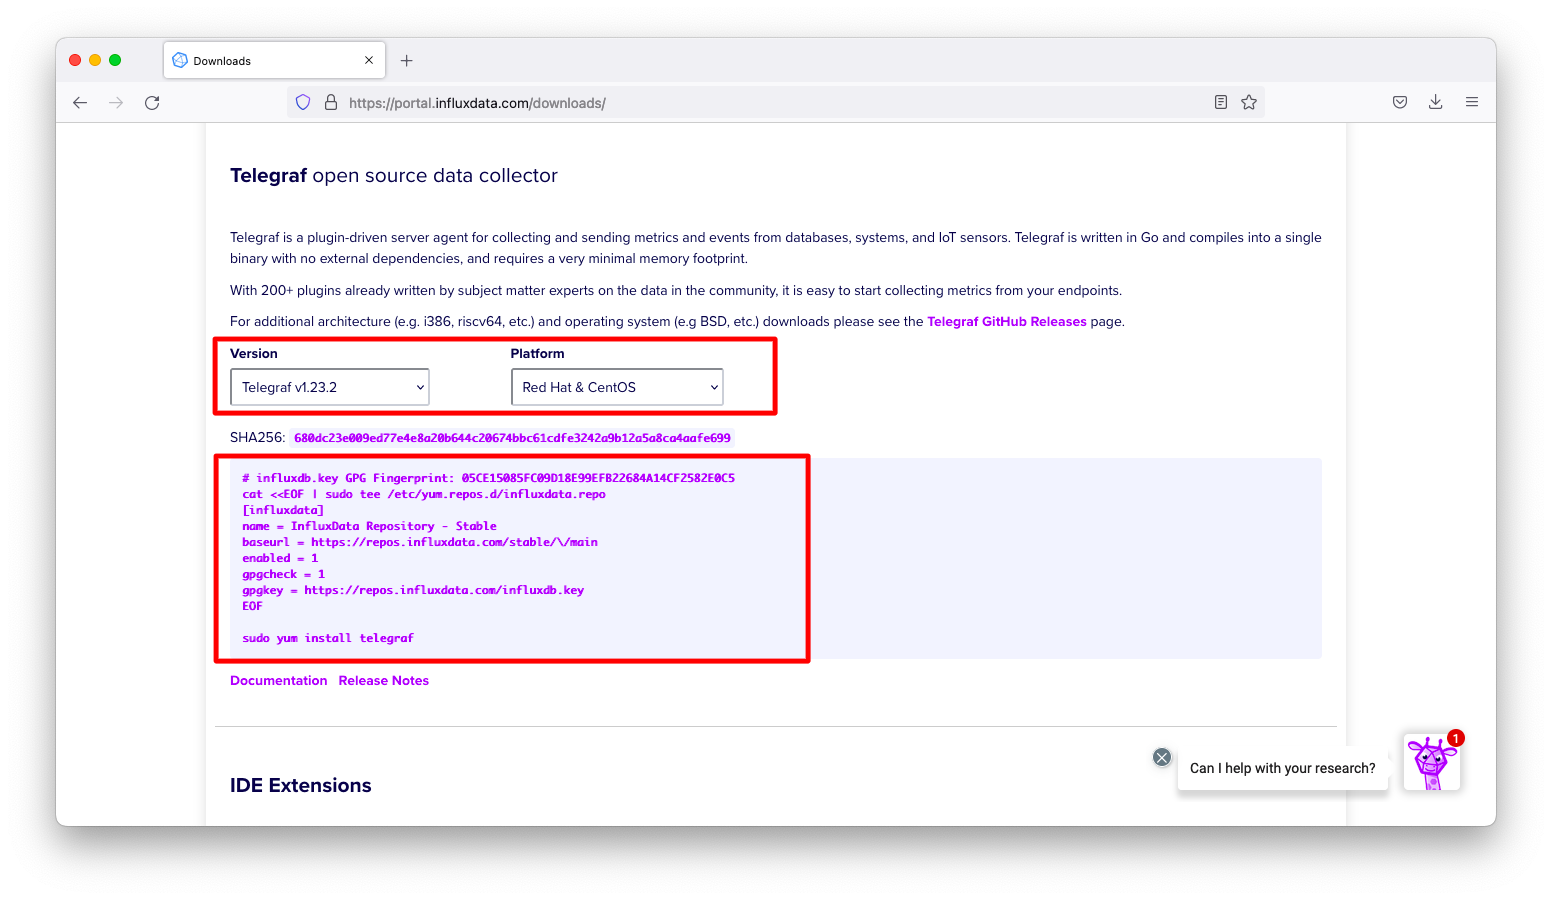
2022/7/16時点の公式の手順をよく見るとリポジトリのURLに誤りがある事が分かりますので、以下のように適宜の修正をして操作します。修正部分は以下ハイライトした4行目です。
cat <<EOF | sudo tee /etc/yum.repos.d/influxdata.repo
[influxdata]
name = InfluxData Repository - Stable
baseurl = https://repos.influxdata.com/rhel/\$releasever/\$basearch/stable
enabled = 1
gpgcheck = 1
gpgkey = https://repos.influxdata.com/influxdb.key
EOF

sudo yum install telegraf
telegrafを起動します。
systemctl enable telegraf.service --now
サンプル設定の生成
Telegrafは以下のようなプラグインで構成されます。
- Input plugins
- Output plugins
- Aggregator plugins
- Processor plugins
- External plugins
今回はTelegrafとPrometheusの連携を動作確認しますので、単純なInputプラグインとOutputプラグインを組み合わせてみましょう。
telegrafコマンドに引数output-listを与えると、使用可能なOutputプラグイン一覧が表示されます。Prometheusと連携させることもできます。
[root@linux010 ~]# telegraf --output-list
Available Output Plugins:

  <omitted>

  opentelemetry
  opentsdb
  prometheus_client
  riemann
  riemann_legacy
  sensu
  signalfx

  <omitted>
telegrafコマンドに引数output-listを与えると、使用可能なInputプラグイン一覧が表示されます。
[root@linux010 ~]# telegraf --input-list
Available Input Plugins:
  KNXListener
  activemq
  aerospike
  aliyuncms
  amd_rocm_smi
  amqp_consumer
  apache

  <omitted>
telegrafコマンドは引数sample-configを与えると、サンプル設定が標準出力されます。input-fileterとoutput-filterは、それぞれInputプラグインとOutputプラグインの指定です。プラグインを複数指定する場合はコロン(:)で区切ります。
telegraf --sample-config \
  --input-filter diskio:cpu:mem \
  --output-filter prometheus_client
動作確認
生成されるサンプル設定を観察します。「OUTPUT PLUGINS」以下の設定を観察すると、tcp9273にInputプラグインで収集した結果が出力される事が分かります。
[root@linux040 ~]# telegraf --sample-config \
>   --input-filter diskio:cpu:mem \
>   --output-filter prometheus_client

  <omitted>

###############################################################################
#                            OUTPUT PLUGINS                                   #
###############################################################################


# Configuration for the Prometheus client to spawn
[[outputs.prometheus_client]]
  ## Address to listen on
  listen = ":9273"

  <omitted>
サンプル設定を/etc/telegraf/telegraf.confに書き込みます。
telegraf --sample-config \
  --input-filter diskio:cpu:mem \
  --output-filter prometheus_client \
  > /etc/telegraf/telegraf.conf
設定反映のため、telegrafを再起動します。
systemctl restart telegraf.service
「http://<IPアドレス>:9273/metrics」にて、Prometheusが読み込める形式でメトリックが表示されている事を確認します。
[root@linux010 ~]# curl -s http://localhost:9273/metrics | head -n 20
# HELP cpu_usage_guest Telegraf collected metric
# TYPE cpu_usage_guest gauge
cpu_usage_guest{cpu="cpu-total",host="linux010.gokatei.go"} 0
cpu_usage_guest{cpu="cpu0",host="linux010.gokatei.go"} 0
cpu_usage_guest{cpu="cpu1",host="linux010.gokatei.go"} 0
# HELP cpu_usage_guest_nice Telegraf collected metric
# TYPE cpu_usage_guest_nice gauge
cpu_usage_guest_nice{cpu="cpu-total",host="linux010.gokatei.go"} 0
cpu_usage_guest_nice{cpu="cpu0",host="linux010.gokatei.go"} 0
cpu_usage_guest_nice{cpu="cpu1",host="linux010.gokatei.go"} 0
# HELP cpu_usage_idle Telegraf collected metric
# TYPE cpu_usage_idle gauge
cpu_usage_idle{cpu="cpu-total",host="linux010.gokatei.go"} 87.70697441043734
cpu_usage_idle{cpu="cpu0",host="linux010.gokatei.go"} 97.18592964823921
cpu_usage_idle{cpu="cpu1",host="linux010.gokatei.go"} 78.07807807807755
# HELP cpu_usage_iowait Telegraf collected metric
# TYPE cpu_usage_iowait gauge
cpu_usage_iowait{cpu="cpu-total",host="linux010.gokatei.go"} 0
cpu_usage_iowait{cpu="cpu0",host="linux010.gokatei.go"} 0
cpu_usage_iowait{cpu="cpu1",host="linux010.gokatei.go"} 0.10010010010010677
Prometheus側の構成
Telegrafの出力結果をstatic_configsで指定すると、PrometheusとTelegrafを連携できます。Prometheus.ymlの設定例は以下の通りです。
scrape_configs:
  - job_name: telegraf
    static_configs:
      - targets:
        - localhost:9273
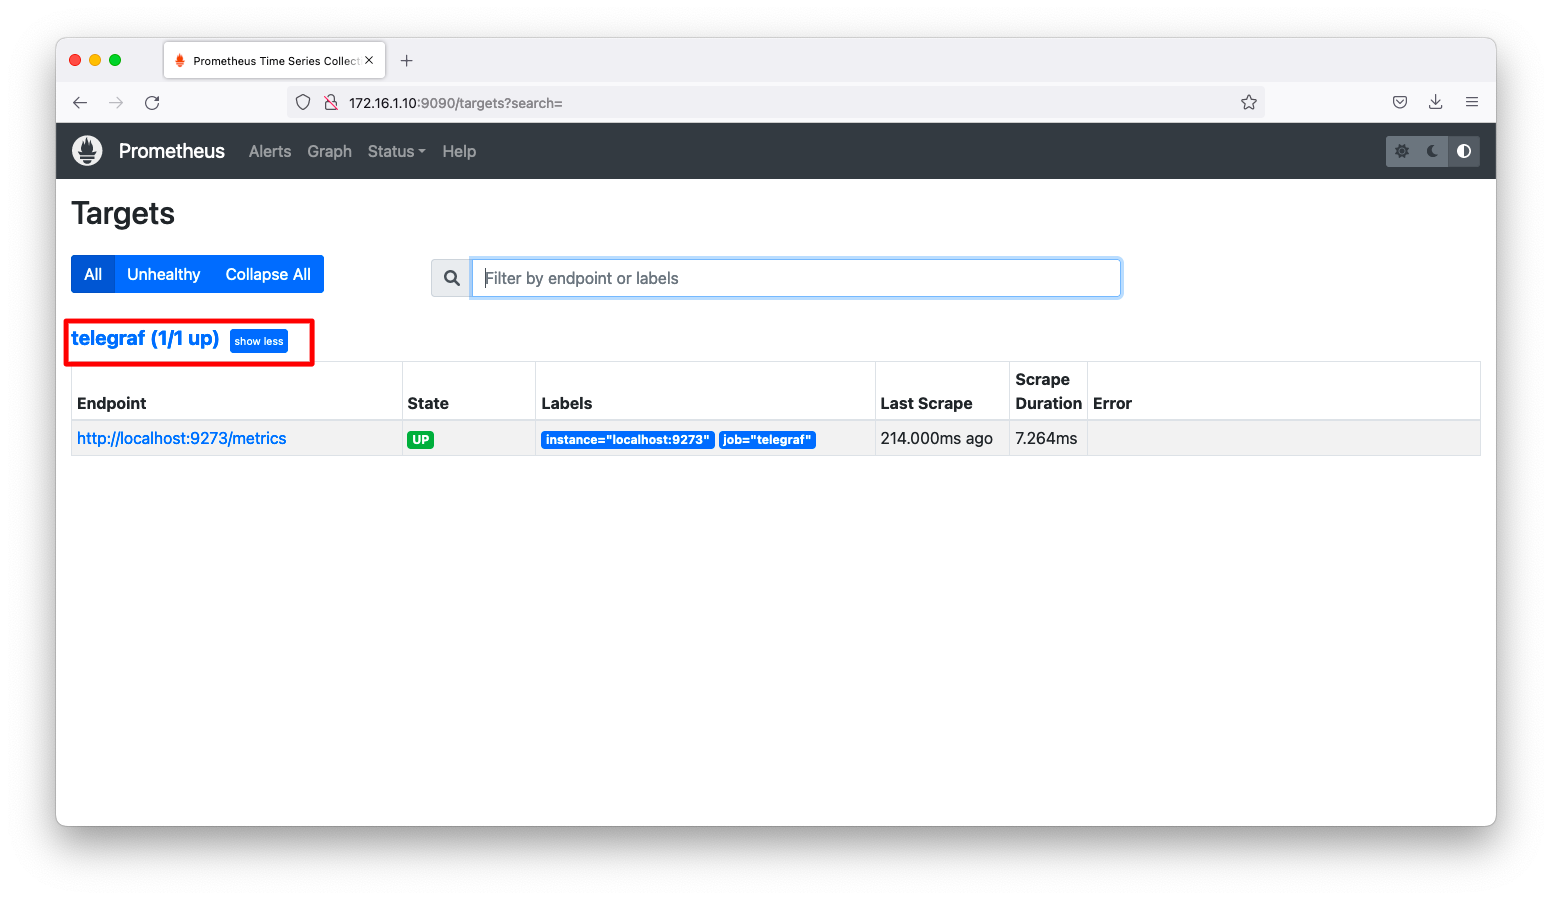
「http://<IPアドレス>:9090/targes」にて「up」と表示される事を確認します。「up」と表示されるという事は、PrometheusがTelegrafを問題なくスクレイプできている事を示します。
補足
snmpgetによるネットワーク機器の監視
telegrafはデータの収集・集計・転送ツールを得意とするツールです。ですので、Prometheusでは適当なプラグインがない場合は、telegrafを使ってデータを収集し、収集結果をprometheusに転送するような構成も採用できます。
まずは以下のようなコマンドを実行し、snmpに関するサンプルconfigを見てみます。
telegraf --sample-config \
  --input-filter snmp
不要なコメントなどが多いので必要な部分のみ抜粋すると以下のような設定になります。デフォルト設定から変更しなければならない最小限の設定はagentsとcommunityのみです。
cat << EOF > /etc/telegraf/telegraf.d/inputs.snmp.conf
###############################################################################
#                            INPUT PLUGINS                                    #
###############################################################################


# Retrieves SNMP values from remote agents
[[inputs.snmp]]
  ## Agent addresses to retrieve values from.
  ##   format:  agents = ["<scheme://><hostname>:<port>"]
  ##   scheme:  optional, either udp, udp4, udp6, tcp, tcp4, tcp6.
  ##            default is udp
  ##   port:    optional
  ##   example: agents = ["udp://127.0.0.1:161"]
  ##            agents = ["tcp://127.0.0.1:161"]
  ##            agents = ["udp4://v4only-snmp-agent"]
  agents = ["udp://192.168.69.1:161"]

  ## Timeout for each request.
  # timeout = "5s"

  ## SNMP version; can be 1, 2, or 3.
  # version = 2

  ## Unconnected UDP socket
  ## When true, SNMP reponses are accepted from any address not just
  ## the requested address. This can be useful when gathering from
  ## redundant/failover systems.
  # unconnected_udp_socket = false

  ## Path to mib files
  ## Used by the gosmi translator.
  ## To add paths when translating with netsnmp, use the MIBDIRS environment variable
  # path = ["/usr/share/snmp/mibs"]

  ## SNMP community string.
  community = "public"

  ## Agent host tag
  # agent_host_tag = "agent_host"

  ## Number of retries to attempt.
  # retries = 3

  ## The GETBULK max-repetitions parameter.
  # max_repetitions = 10

  ## SNMPv3 authentication and encryption options.
  ##
  ## Security Name.
  # sec_name = "myuser"
  ## Authentication protocol; one of "MD5", "SHA", "SHA224", "SHA256", "SHA384", "SHA512" or "".
  # auth_protocol = "MD5"
  ## Authentication password.
  # auth_password = "pass"
  ## Security Level; one of "noAuthNoPriv", "authNoPriv", or "authPriv".
  # sec_level = "authNoPriv"
  ## Context Name.
  # context_name = ""
  ## Privacy protocol used for encrypted messages; one of "DES", "AES", "AES192", "AES192C", "AES256", "AES256C", or "".
  ### Protocols "AES192", "AES192", "AES256", and "AES256C" require the underlying net-snmp tools
  ### to be compiled with --enable-blumenthal-aes (http://www.net-snmp.org/docs/INSTALL.html)
  # priv_protocol = ""
  ## Privacy password used for encrypted messages.
  # priv_password = ""

  ## Add fields and tables defining the variables you wish to collect.  This
  ## example collects the system uptime and interface variables.  Reference the
  ## full plugin documentation for configuration details.
  [[inputs.snmp.field]]
    oid = "RFC1213-MIB::sysUpTime.0"
    name = "uptime"

  [[inputs.snmp.field]]
    oid = "RFC1213-MIB::sysName.0"
    name = "source"
    is_tag = true

  [[inputs.snmp.table]]
    oid = "IF-MIB::ifTable"
    name = "interface"
    inherit_tags = ["source"]

    [[inputs.snmp.table.field]]
      oid = "IF-MIB::ifDescr"
      name = "ifDescr"
      is_tag = true
EOF
telegrafを再起動し、設定を反映させます。
systemctl restart telegraf.service
ifInOctetsなどのネットワーク機器固有の情報を取得できる事を確認します。
[root@linux010 ~]# curl -s http://localhost:9273/metrics | grep -i ifInOctets
# HELP interface_ifInOctets Telegraf collected metric
# TYPE interface_ifInOctets untyped
interface_ifInOctets{agent_host="192.168.69.1",host="linux010.gokatei.go",ifDescr="GigaEthernet0",ifIndex="1",ifPhysAddress="00:60:b9:e4:40:ad",ifSpecific=".0.0",source="NEC001"} 8.92464295e+08
interface_ifInOctets{agent_host="192.168.69.1",host="linux010.gokatei.go",ifDescr="GigaEthernet0-Multiplexor",ifIndex="3",ifPhysAddress="",ifSpecific=".0.0",source="NEC001"} 8.92464175e+08
interface_ifInOctets{agent_host="192.168.69.1",host="linux010.gokatei.go",ifDescr="GigaEthernet0.0",ifIndex="399",ifPhysAddress="",ifSpecific=".0.0",source="NEC001"} 8.92464175e+08
interface_ifInOctets{agent_host="192.168.69.1",host="linux010.gokatei.go",ifDescr="GigaEthernet0.0-LAN",ifIndex="37",ifPhysAddress="",ifSpecific=".0.0",source="NEC001"} 8.92464175e+08
interface_ifInOctets{agent_host="192.168.69.1",host="linux010.gokatei.go",ifDescr="GigaEthernet1",ifIndex="2",ifPhysAddress="00:60:b9:e4:40:6d",ifSpecific=".0.0",source="NEC001"} 3.2206956e+07
interface_ifInOctets{agent_host="192.168.69.1",host="linux010.gokatei.go",ifDescr="GigaEthernet1-Multiplexor",ifIndex="4",ifPhysAddress="",ifSpecific=".0.0",source="NEC001"} 1.400076752e+09
interface_ifInOctets{agent_host="192.168.69.1",host="linux010.gokatei.go",ifDescr="GigaEthernet1.0",ifIndex="400",ifPhysAddress="",ifSpecific=".0.0",source="NEC001"} 1.400076752e+09
interface_ifInOctets{agent_host="192.168.69.1",host="linux010.gokatei.go",ifDescr="GigaEthernet1.0-LAN",ifIndex="38",ifPhysAddress="",ifSpecific=".0.0",source="NEC001"} 1.400076752e+09
interface_ifInOctets{agent_host="192.168.69.1",host="linux010.gokatei.go",ifDescr="GigaEthernet1.10",ifIndex="443",ifPhysAddress="",ifSpecific=".0.0",source="NEC001"} 6.2864739e+07
interface_ifInOctets{agent_host="192.168.69.1",host="linux010.gokatei.go",ifDescr="GigaEthernet1.10-LAN",ifIndex="40",ifPhysAddress="",ifSpecific=".0.0",source="NEC001"} 6.2864739e+07
interface_ifInOctets{agent_host="192.168.69.1",host="linux010.gokatei.go",ifDescr="GigaEthernet1.2",ifIndex="435",ifPhysAddress="",ifSpecific=".0.0",source="NEC001"} 0
interface_ifInOctets{agent_host="192.168.69.1",host="linux010.gokatei.go",ifDescr="GigaEthernet1.2-LAN",ifIndex="39",ifPhysAddress="",ifSpecific=".0.0",source="NEC001"} 0
interface_ifInOctets{agent_host="192.168.69.1",host="linux010.gokatei.go",ifDescr="GigaEthernet1.20",ifIndex="453",ifPhysAddress="",ifSpecific=".0.0",source="NEC001"} 192
interface_ifInOctets{agent_host="192.168.69.1",host="linux010.gokatei.go",ifDescr="GigaEthernet1.20-LAN",ifIndex="41",ifPhysAddress="",ifSpecific=".0.0",source="NEC001"} 192
interface_ifInOctets{agent_host="192.168.69.1",host="linux010.gokatei.go",ifDescr="GigaEthernet1.30",ifIndex="463",ifPhysAddress="",ifSpecific=".0.0",source="NEC001"} 2.86423266e+09
interface_ifInOctets{agent_host="192.168.69.1",host="linux010.gokatei.go",ifDescr="GigaEthernet1.30-LAN",ifIndex="42",ifPhysAddress="",ifSpecific=".0.0",source="NEC001"} 2.864232569e+09
interface_ifInOctets{agent_host="192.168.69.1",host="linux010.gokatei.go",ifDescr="Loopback0",ifIndex="395",ifPhysAddress="",ifSpecific=".0.0",source="NEC001"} 0
interface_ifInOctets{agent_host="192.168.69.1",host="linux010.gokatei.go",ifDescr="Loopback0.0",ifIndex="535",ifPhysAddress="",ifSpecific=".0.0",source="NEC001"} 0
interface_ifInOctets{agent_host="192.168.69.1",host="linux010.gokatei.go",ifDescr="Null0",ifIndex="397",ifPhysAddress="",ifSpecific=".0.0",source="NEC001"} 0
interface_ifInOctets{agent_host="192.168.69.1",host="linux010.gokatei.go",ifDescr="Null0.0",ifIndex="537",ifPhysAddress="",ifSpecific=".0.0",source="NEC001"} 0
interface_ifInOctets{agent_host="192.168.69.1",host="linux010.gokatei.go",ifDescr="Tunnel0",ifIndex="267",ifPhysAddress="",ifSpecific=".0.0",source="NEC001"} 0
interface_ifInOctets{agent_host="192.168.69.1",host="linux010.gokatei.go",ifDescr="Tunnel0.0",ifIndex="794",ifPhysAddress="",ifSpecific=".0.0",source="NEC001"} 3.90120572e+08
[root@linux010 ~]#
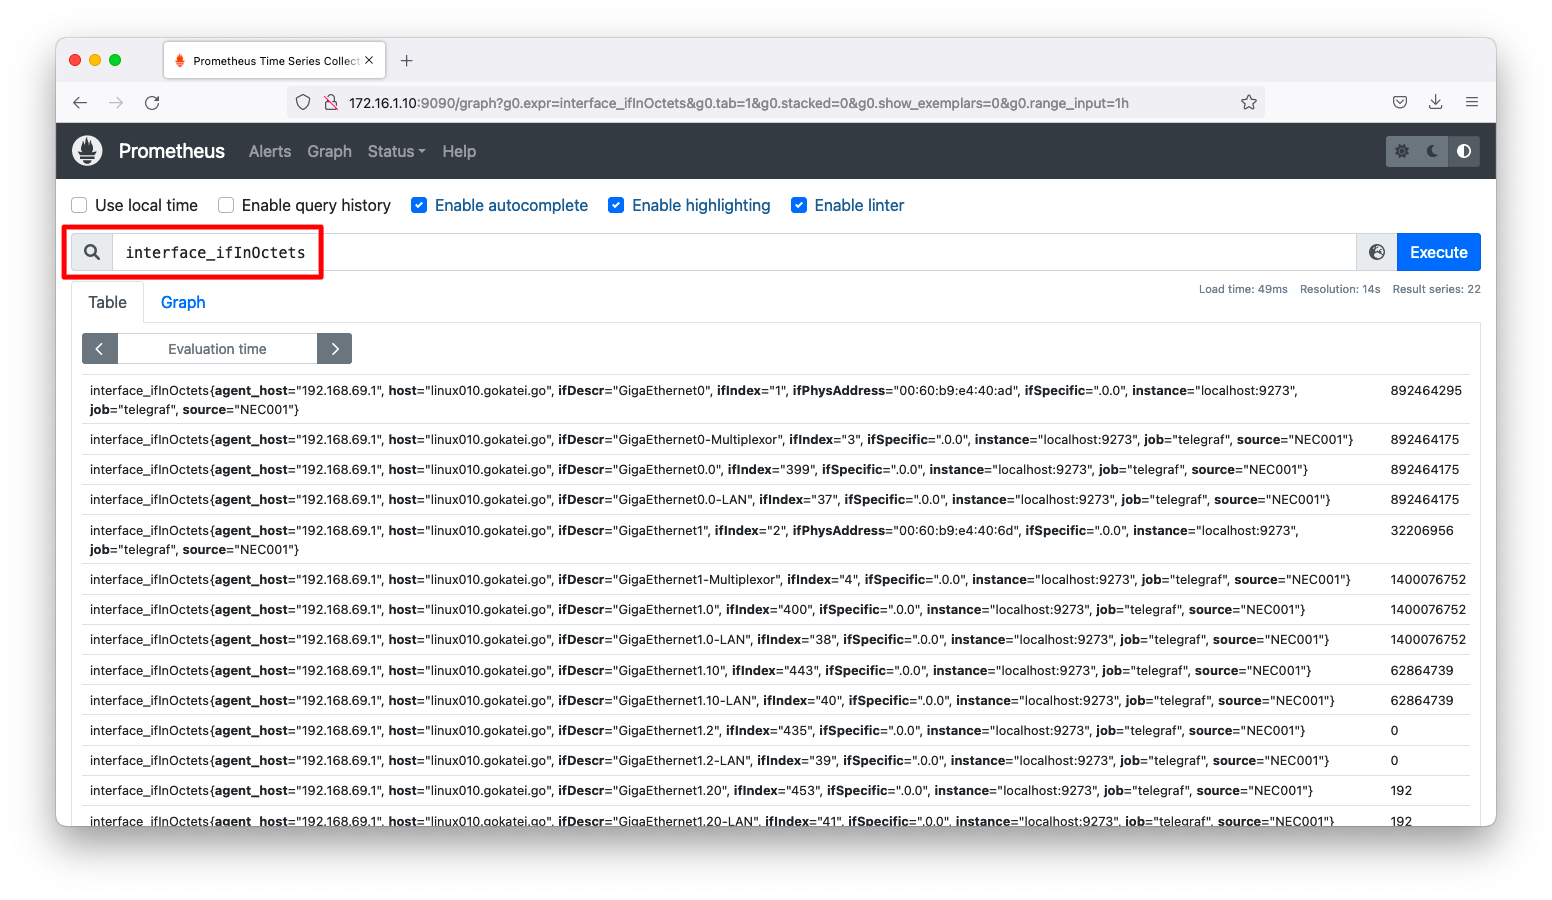
「http://<IPアドレス>:9090/graf」にて、ネットワーク機器のトラフィックなどのメトリックを取得できている事を確認します。
リモートストーレジへの転送
prometheusのメトリックの蓄積結果を外部のストレージへ転送して長期的な保管をしたい要件を想定します。このような要件で、外部のストレージがPrometheusのデータ形式に対応していればそのままの転送ができますが、Prometheusのデータ形式に対応していない場合は何らかのconverterが必要になります。
telegrafの代表的な使い方のひとつとして、Prometheusのデータを変換してInfluxdb2へ転送する使い方があります。この設定方法は「Prometheus リモートストレージ (InfluxDB v2編)」を参照ください。